What Corneal Shape Reveals About Corneal Health
Mapping the irregular cornea reveals much about disease status and its amenability to treatment. Here's a review.
Release Date:
May 2016
Expiration Date:
May 1, 2019
Goal Statement:
This course discusses the types and use of corneal topographers for keratoconus evaluation.
Faculty/Editorial Board:
 Mr. Kojima is a research scientist and clinical instructor at the Pacific University College of Optometry. He is also the clinical research and development director for Precision Technology and a fellow of the American Academy of Optometry, the British Contact Lens Association, the Scleral Lens Association and the International Orthokeratology Academy.
 Dr. Eiden is the president and medical director of North Suburban Vision Consultants. He is also the president and cofounder of the International Keratoconus Academy.
Credit Statement:
This course is COPE approved for 1 hour of CE credit. COPE ID is 49824-GO. Please check your state licensing board to see if this approval counts toward your CE requirement for relicensure.
Joint Sponsorship Statement:
This continuing education course is joint-sponsored by the Pennsylvania College of Optometry.
Disclosure Statement:
Mr. Kojima is the clinical research and development director for Precision Technology Services as well as a shareholder in KATT Design Group and clinical advisor to Medmont International. Dr. Eiden has consulting, research and/or financial interest in the following: Alcon, Alden Labs, Bausch + Lomb, CooperVision, Oculus, Oasis, Optovue, Special Eyes, SynergEyes, Visionary Optics, Vistakon, EyeVis Eye & Vision Research Institute and the International Keratoconus Academy of Eye Care Professionals.
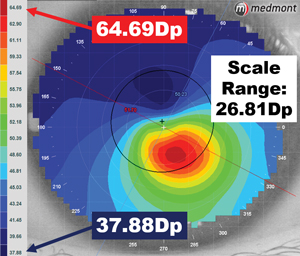 |
| Fig. 1. Analyze the scale range of power distributed across the corneal surface on the axial map. Distributions of less than 10D of power are typical of normal eyes. |
One of the most sensitive yet underused instruments in practice today for identifying and characterizing corneal disorders is the corneal topographer. This device provides us with an array of analysis options that can accurately reveal conditions that warrant our attention or treatment. However, as with most advanced instrumentation available to practitioners today, understanding and keeping track of the wide range of options for interpreting results can be overwhelming. For example, which analysis display is best at uncovering the earliest signs of a given disease? How should we differentiate one condition from another? Which functions of the technology help to monitor patients if long-term changes are occurring?
The corneal topographer can be a powerful tool in the hands of both the experienced and neophyte user when properly armed with an understanding of the fundamentals.
This article will discuss the various capabilities and functions of the technology in disease screening, particularly as it relates to keratoconus and corneal thinning disorders.
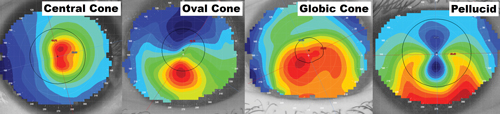 |
Fig. 2. From left to right: (a) displays central keratoconus, also known as "nipple cones," present within or near to the pupil, while (b) demonstrates oval keratoconus, which is usually larger in size than central cones and typically presents inferior to the corneal apex. It is also the most common cone presentation. (C) globic keratoconus involves the largest surface area of the cornea compared with central or over cones, while (d) pellucid marginal degeneration presents as thinning nearer to the peripheral cornea and can appear as "kissing doves" or "butterfly wings" on the axial map. |
Types of Units
Though dozens of corneal mapping systems exist, all can be categorized as either reflection or projection units.1 Reflection systems map the anterior surface of the cornea and provide noninvasive tear film breakup and stability testing as added features.1,2 Newer reflective-based topographers are capable of measuring beyond the cornea to provide information on scleral shape and sagittal depth, which can be beneficial when fitting large diameter contact lenses.3,4 However, regardless of additional features, all reflective-based systems are only capable of measuring the anterior surface and therefore cannot describe the posterior cornea or its thickness.
By comparison, projection-based instruments measure both the anterior and posterior corneal surface.1 This also allows for pachymetry measurement of the cornea's thickness. Projection topography provides a more comprehensive picture of the cornea as a whole and is generally favored by surgical sites when considering LASIK candidacy
When attempting to determine if a particular cornea is normal or abnormal, one of the simplest analyses possible is to assess the range of power distributed across the corneal surface.5 Using an "axial" interpretation, determine the flattest dioptric power that the topographer can read on the selected cornea. Then, find the steepest reading on the surface. The dioptric difference between the two is the scale range of power (Figure 1). Normal corneas distribute less than 10D of power from the flattest to steepest readings on the axial display. This analysis option may be described by some units as the power or sagittal display.
 |
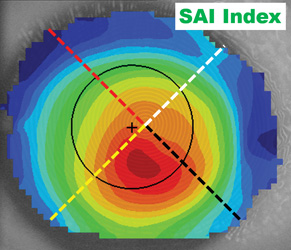 |
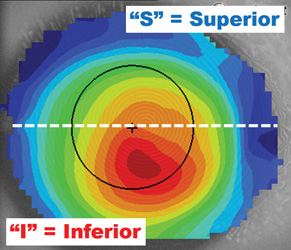
| Fig. 3. The I-S value measures the average power of the inferior and superior hemispheres and determines the differential. I-S values of greater than 1.5D are indicative of an abnormal eye. | Fig. 4. The surface asymmetry index (SAI) compares the oblique meridians. When one radial is a mirror of its opposing radial, the eye is considered symmetric. Higher SAI values indicate more asymmetry. |
Another analysis option of diagnostic value is the tangential display, which is known in some instruments as the instantaneous or true curvature map.1 This interpretation is more sensitive to finite surface changes in the eye, which the axial display can miss due to the smoothing effects inherent in its formula. A tangential map clearly defines the size, shape and position of the anomaly or diseased tissue. This may be helpful when characterizing the presentation of one condition over another.
To help us simply and efficiently classify the various types, one study identified the following criteria: nipple cones measure less than 3mm in diameter and generally are located more central to the pupil, while oval keratoconic presentations had diameters of 3.0mm to 5.5mm and are usually present inferior to the visual axis (Figure 2a and 2b).6 Cones greater than 5.5mm are considered globic and involve much more of the corneal surface, but present in a smaller percentage of cases (Figure 2c).6 Lastly, pellucid and Terrien's marginal degenerations are other forms of corneal thinning disorders that are rare and involve tissue closer to the limbus than keratoconus typically does (Figure 2d).6
Disease Indexing
Though corneal topography axial and tangential maps can be used to identify when the condition is moderate or severe, neither interpretation can provide a definitive diagnosis when the disease is mild or in the early-onset stage. For this reason, a series of disease detection indices have been developed; these eliminate the need for operator experience in comprehending the subjective appearance of topography contours and instead provide results using a mathematical analysis of the corneal shape.
The first and possibly most relied-upon technique for assessing possible signs of disease is the inferior-superior (I-S) value (Figure 3).7 This is a comparison of the average power of the inferior cornea against the average of the superior cornea: if one hemisphere is significantly different from the other, this is a strong indicator of an abnormal and possibly diseased eye. Considering approximately 90% of the corneal thinning disorders present in the inferior hemisphere, it's logical for the inferior cornea to be significantly steeper than the superior. As such, I-S values greater than 1.5D are indicative of a diseased or abnormal eye.
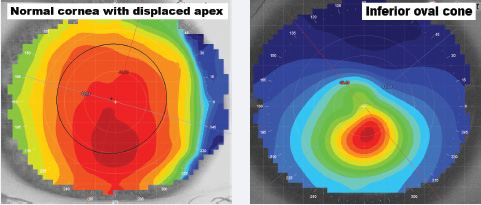 |
| Fig. 5. Left to right: (a) displays a normal cornea with a displaced apex, while (b) displays an oval keratoconus cornea with an inferior cone. Note the gradual rate of flattening from the steepest central curvature to flatter peripheral shape in the former, and the significant change in contour or shape within an acute area compared with the normal cornea in the latter. |
Another commonly employed disease detection index is the surface asymmetry index (SAI), which compares the principal oblique meridians for symmetry (Figure 4).7 For example, the curvature from the apex along axis 45° is compared to the opposing curvature from the center along axis 225°. Then, the same hemi-chord comparison is completed between axis 135° and 315°. A completely symmetric eye would have an SAI value of zero, but if the oblique meridians are significantly different from each other, this indicates an asymmetric surface instead. SAI values greater than 1.0D are indicative of a diseased or irregular eye.
The last disease detection index typically employed is the surface regularity index (SRI), a center-weighted analysis that determines the relative smoothness of the cornea.7 High power distributions within the pupil may be indicative of an irregular cornea: though a normal, healthy eye would have a smooth central cornea to allow for high quality visual acuity, a diseased eye with radical surface power changes within the pupil is more likely to degrade vision. SRI values greater than 0.80 are considered abnormal; suspect corneal disease in such eyes. Simply put, the higher the value, the more abnormal the surface. The scale range, I-S, SAI and SRI would indicate a symmetrical or normal eye is closer to zero values while a more irregular or diseased eye would be a higher value.
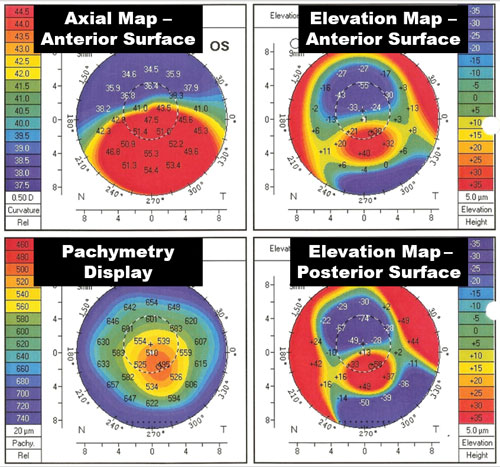 |
| Fig. 6. A typical projection topographer screen displaying anterior surface shape, anterior surface elevation, posterior surface elevation and corneal thickness (pachymetry). |
The position and size of the steepest curvature, or apex, can also provide insight when diagnosing disease.6 For example, a normal, healthy eye typically exhibits an axial or tangential topography, with the steepest curvature near the center and a gradual rate of flattening towards the periphery (Figure 5a). By comparison, a keratoconic patient typically exhibits an apex inferior of center, with a higher rate of curvature change within a smaller surface area of the topography (Figure 5b). In central or nipple keratoconus, the apex might present central to the pupil, but regardless of the position of the apex, it's common in diseased and irregular eyes to see radical power changes within tighter distances as compared with normal, healthy eyes.
Another interpretation that topography software allows is the elevation display. This map overlays a best-fit spherical surface on the anterior surface and defines where the tissue is above the surface (red) and below (in blue) in microns.8 This can be helpful in determining how high the elevation changes in the eye surface are. Projection topographers have the added benefit of also being able to image both the posterior and anterior surfaces (Figure 6). Research has suggested that the posterior elevation analysis may be more accurate in identifying the earliest signs of thinning disorders, where at times the anterior surface may not reveal irregularity.9,10
Often, characterizing the difference between keratoconus, pellucid (PMD) and Terrien's marginal degeneration (TMD) can be difficult. Corneal topography can help to make distinguishing between the conditions relatively easier. For example, keratoconus appears on the axial or tangential map (in red) as a round or oval acute area of steep curvature, generally within the central or paracentral cornea.11 By comparison, PMD or TMD present with red curvature more peripheral and closer to the limbus.12 Additionally, PMD takes on a "kissing doves" or "butterfly wing" appearance on the axial map, while TMD presents in various other patterns. Both PMD and TMD, however, are more typically associated with lower flat K (Kf) readings than keratoconus is. Using PMD as an example, the Kf value is usually less than or equal to 40D, whereas in keratoconus the Kf value is usually greater than or equal to 45D.
 |
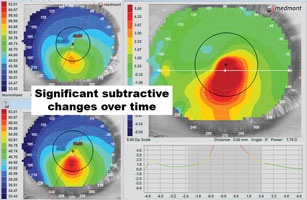 |
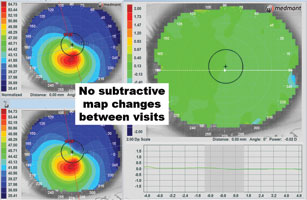
| Fig. 7. Left to right: (a) using the subtractive map, consecutive visits can be compared to determine if there is disease progression. The subtractive analysis on the right shows virtually all green, indicating little if any change in the corneal shape between visits. (b) The subtractive analysis on the right shows a signifi cant steepening (in red) between the two visits, indicating disease progression or contact lens molding that can also cause shape change. | |
When monitoring corneal disease cases, the subtractive or difference maps can be helpful in defining the smallest changes over time. Typically, this analysis function is used mostly in orthokeratology cases to assess the corneal changes produced following overnight wear. However, the subtractive map—when employed in a diseased eye—can determine if the condition is stable or advancing. Comparing two scans, a subtractive map demonstrating all green indicates no changes over time, but red and blue areas on the same map indicate steepening and flattening, respectively (Figures 7a and 7b). If there is steepening over the cone, this likely indicates disease progression, though it can also be the result of contact lens molding. Conversely, we may often see more blue over the cone on the subtractive map following corneal crosslinking.
Contact Lens Fitting
Ultimately, if we are diagnosing corneal thinning disorders in our patients, there is a high likelihood we will be fitting specialty contact lenses to improve the patient's visual quality of life. Though many time-tested custom soft lens options exist for keratoconus today, the axial map can help us better understand the power of the anterior surface and whether a soft lens is the right choice for a particular patient. For example, if the distributed power within the pupil shows a range greater than 10D, this could result in too much aberration for a custom soft lens to mask. Additionally, the presence or absence of symmetry within the pupil can be telling: the more extreme the power distribution, the less likely a conventional or custom soft lens will be able to mask the asymmetry.
 |
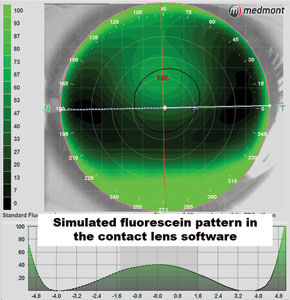 |
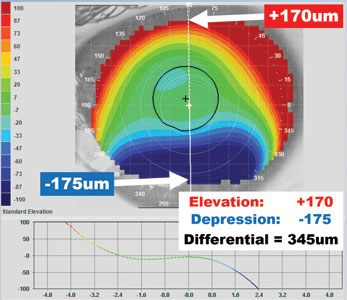
| Fig. 8. Using the elevation map, find the highest point of curvature in microns in the red area. Then find the opposing lowest point of elevation in the blue area. When the elevation differential is less than 350μm, corneal GPs are frequently successful. When the differential is greater than 350μm, consider a scleral. | Fig. 9. The contact lens modules in some corneal topographers create simulated fluorescein patterns and can be helpful tools in selecting the first diagnostic lens to try, or determining whether a specific lens might achieve a desired fit. |
Another question we face is whether to fit a particular eye with a corneal GP or scleral lens. One study attempted to answer this question by identifying the highest point of elevation in microns (red area) and the lowest point of depression (blue area) on each eye in a topographical elevation map. The difference in height between the two was considered to be the elevation differential (Figure 8). The study determined that patients with less than or equal to 350μm of elevation change could achieve a successful corneal GP lens fit 88% of the time, while those with greater than 350μm of elevation change required a scleral lens to fit over the high asymmetry of the eye.13
In addition to steering us toward the right modality, corneal topographers also come with contact lens fitting modules. These programs allow for simulated fluorescein modeling of specific lens designs to accurately determine the initial trial or custom parameters that are best suited to the eye (Figure 9). Research demonstrates that corneal topography fitting software can predict the fluorescein pattern 74% of the time, regardless of the map quality.14 However, with good quality images—which can be dependent on the eye's surface and fissure size—this fitting accuracy can be improved to 95%. These modules can help reduce chair time and lab costs by improving the efficiency of the trial process and accuracy of the initial custom parameters.
Tomography vs. Topography
The term topography refers to a detailed representation or description of the surface characteristics of a structure. Corneal topography is typically performed with Placido ring technology that provides curvature data of the anterior corneal surface. In contrast, tomography is the process of generating a two-dimensional cross-sectional image of a slice through a three-dimensional object. One method to achieve this is through the use of Scheimpflug imaging (Figure 10). This technology is used by instruments like Pentacam (Oculus) and Galilei (Zeimer) to measure the anterior and posterior corneal surface, as well as other anterior segment structures. A rotating Scheimpflug camera (single in Pentacam; dual cameras in Galilei) creates a 360° representation of the anterior segment.
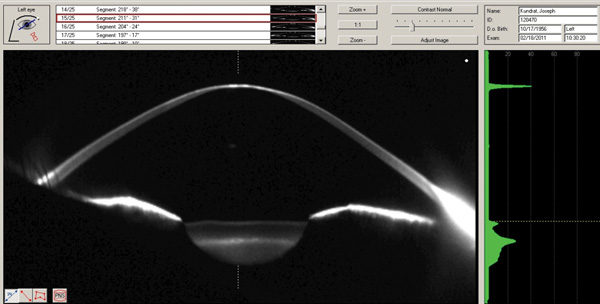 |
| Fig. 10. Scheimpflug image of a case of advanced keratoconus along an oblique meridian. |
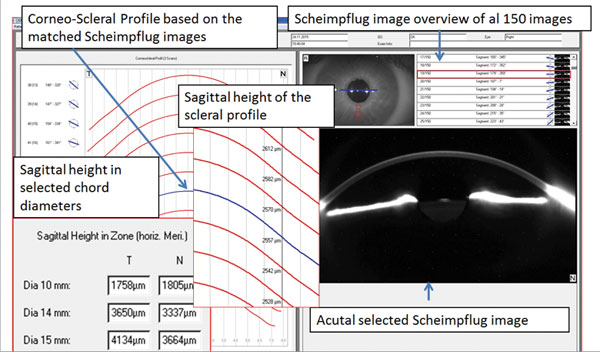 |
| Fig. 11. Pentacam corneo-scleral profile software. |
Scheimpflug tomography of the anterior segment provides true elevation-based data that allows for measurements of anterior corneal elevation, posterior corneal elevation, full corneal thickness (global pachymetry) and high quality imaging and structural measurements of the anterior segment. Elevation data can also be used to derive corneal curvature measurements analogous to the curvature data obtained by Placido-based corneal topography. True elevation corneal measurements and data of both the anterior and posterior cornea, along with global pachymetry data, allows for highly accurate detection of corneal ectatic diseases like keratoconus. Specifically, posterior corneal elevation anomalies will precede and be more advanced than anterior corneal elevation and curvature anomalies in keratoconus.
There are many cases in which the anterior corneal surface is found to be normal—both in terms of curvature and elevation—but a posterior corneal elevation anomaly still exists. This can result in what would be a false negative for keratoconus detection, if only the anterior corneal surface were analyzed (such as with Placido-based corneal topography). Conversely, some conditions or situations can result in what would appear to suggest keratoconus, when, in fact, the cornea is quite normal. Displaced corneal apices and large deviations of the visual axis (large angle Kappa) are two instances in which Placido topography, or any representations of anterior corneal surface curvature, would suggest keratoconus while elevation-based Scheimpflug would suggest an otherwise normal cornea.16
Additionally, anomalies of global pachymetry are also highly diagnostic for keratoconus. Though many cases of keratoconus are characterized by the thin point of the cornea being below that normal range of minimum corneal thickness, it is the rate of change of corneal thickness from the thin point out peripherally that is the most sensitively diagnostic, even in cases where the thickness of all points in the cornea are statistically normal.17
Scheimpflug tomography can also aid in the differential diagnosis of true pellucid marginal corneal degeneration. Traditionally, the classic "kissing dove" or "crab claw" pattern seen on curvature topography maps is considered characteristic of PMD; however, because true PMD exhibits localized peripheral corneal thinning inferiorly 1mm from the limbus, in the majority of cases the corneal thin point on global pachymetry and corneal elevation maps is actually significantly more central in regular PMD than in true PMD. In fact, the global pachymetry maps and both the anterior and posterior corneal elevation maps are quite typical of true keratoconus rather than pellucid.18
One of the newest developments in Scheimpflug tomography is the technology's ability to image and measure corneo-scleral profiles. These measurements can be used to detect and quantify asymmetries of scleral shape when performed in 360°. Software is under development to enable this data to be used in the virtual design of both corneal and scleral contact lenses (Figure 11).
Though we cannot rely on just one instrument, corneal topography itself can be sensitive to the earliest presentation of corneal thinning disorders, and can provide us with the ability to categorize the type of condition its severity. Understanding its functions can greatly aid practitioners both in the characterization of the condition and the selection of a contact lens modality to best suit the patient.
1. Mountford J, Ruston D, Dave T. Orthokeratology – Principles and Practice. New York: Butterworth Heinemann; 2004:17-47. |