The Structure-Function Junction
Improve your glaucoma diagnostic abilities by looking beyond the OCT.
Goal Statement:
Glaucoma's prevalence continues to increase because of an aging majority population and significant growth in high-risk populations. Evidence-based medicine demonstrates that combining functional testing with structural imaging can improve diagnosis and detection of early glaucoma. This article reviews the natural history of glaucoma and the current applications of functional testing.
Faculty/Editorial Board:
Craig Thomas, OD
Credit Statement:
This course is COPE approved for 2 hours of CE credit. COPE ID 46410-GL. Please check your state licensing board to see if this approval counts toward your CE requirement for relicensure.
Joint-Sponsorship Statement:
This continuing education course is joint-sponsored by the Pennsylvania College of Optometry.
Disclosure Statement:
Dr. Thomas is a paid consultant for Konan Medical and Johnson & Johnson Vision Care.
All practicing optometrists are tasked with evaluating the likelihood of glaucoma development in each of our patients. Fortunately, for most individuals the risk is low. However, population studies show that people with early glaucoma see the optometrist again and again without being diagnosed. As a result, patients are unnecessarily losing vison.1
Diagnosing this "sneak thief of sight" is often a subjective process that requires a multifaceted, patient-by-patient approach.
Traditionally, we've been told that structural damage must precede visual field loss.2 New research challenges the conventional wisdom that said at least 25% to 35% of retinal ganglion cells must be lost before the first visual field defect appears.2
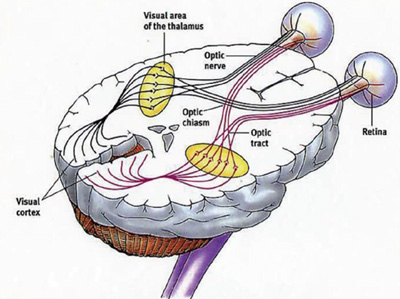
The Visual Pathway
|
Receptors • Rod cells in retina. • Cone cells in the retina. Transmitters • Optic nerve. • Optic chiasm. • Optic tract. • Lateral geniculate nucleus. • Optic radiations. Visual Cortex • Receives axonal projections from the lateral geniculate nucleus and uses neural circuits to process visual information. |
Although detectable structural abnormality may precede functional abnormality in some patients, the opposite may be true in others.2 Complicating the issue is the fact that functional abnormalities vary widely between individual patients and on repeated measurements.2 As a result of this lack of consistency in diagnostic test results, optometrists should use measurements in one domain (structure or function) to support the interpretation of measurements in the other.2 In other words, doctors today must decode a combination of diagnostic test results to deliver a comprehensive assessment of a patient suspected of developing glaucoma.
This article explains the why and how of a comprehensive examination that includes both structural and functional testing and how recognizing the value of functional testing can help us better diagnose glaucoma earlier.
Natural History
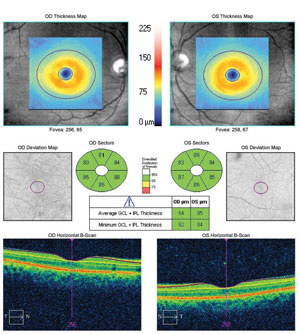 |
| Normal ganglion cell complex measured in both eyes despite the presence of retinal nerve fiber layer defects in each eye. |
Primary open-angle glaucoma is characterized by structural changes to the optic nerve head and peripapillary retina that are associated with characteristic functional deficits.
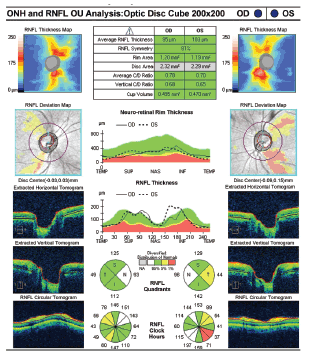
In patients suspected of developing glaucoma, structural investigations of the eye should focus on the retinal ganglion cells and their axons. For these, we use imaging devices such as optical coherence tomography (OCT) to provide quantification of the neuroretinal rim area, retinal nerve fiber layer thickness and macular ganglion cell analysis.2
In addition to progressive ganglion cell loss, glaucoma is associated with aqueous outflow restrictions, nonphysiologic intraocular pressure, abnormal ocular perfusion and an abnormal rate of cellular apoptosis.
Today, researchers believe glaucoma is a neurodegenerative disease that affects the brain as well as the eye. Clear evidence from electrophysiologic studies shows glaucoma-induced damage is present throughout the neural pathways of the brain.3
The first indication of glaucoma-induced neurodegenerative brain damage is early impairment of the ganglion cells. The second indication involves the impairment of the brain's parallel ganglion cell pathways secondary to transynaptic degeneration and the third indication involves impairment of brain function at the level of the lateral geniculate nucleus.3
The Case for Functional Tests
In progressive glaucoma, a structure-function relationship exists between optic disc cupping and changes in the visual field.2 Research shows that, for most people, minimal field change occurred when the vertical cup-to-disc ratio enlarged from 0.30 to 0.60 and that more marked visual field changes occurred when the cup-to-disc ratio enlarged from 0.60 to 1.0.2 In the majority of patients with glaucoma, there is a functional latency period where structural change occurs early in the natural history of the disease without functional vision loss.2 In other words, especially in early glaucoma, we usually see a greater amount of glaucoma-induced structural damage relative to the amount of glaucoma-induced functional damage. Alternatively, in more advanced glaucoma, it appears as if functional vision loss changes at a greater rate than structural damage.2
This curvilinear relationship between structural measures of glaucomatous optic atrophy and visual field measurements explains the contemporary opinion of a "functional reserve" period in most patients with early glaucoma where the optic nerve gets worse but the visual field does not.
Structural Changes and Functional Deficits |
|
| STRUCTURAL CHANGES • Progressive loss of retinal ganglion cells • Enlargement of optic cup • Changes in optic nerve head coloration • Fallout of the retinal nerve fiber layer • Wipeout of the neuroretinal rim |
FUNCTIONAL DEFICITS • Visual field defects • Abnormal visual evoked potential waveforms • Abnormal electroretinography waveforms • Relative afferent pupillary defect • Loss of chromatic discrimination |
Even though most patients with glaucoma demonstrate this functional latency period early in the natural history of their disease, some do not. Substantial evidence shows some patients with glaucoma develop visual field defects before structural defects.2
One explanation for this finding is the concept of ganglion cell dysfunction. In early glaucoma, ganglion cells may become dysfunctional before they die.2 This dysfunction produces a reduction in visual field sensitivity that does not correlate with OCT measurements of the retinal nerve fiber layer or ganglion cell complex. It also explains how patients can develop measurable visual field defects before they develop clinically measurable structural damage.2
|
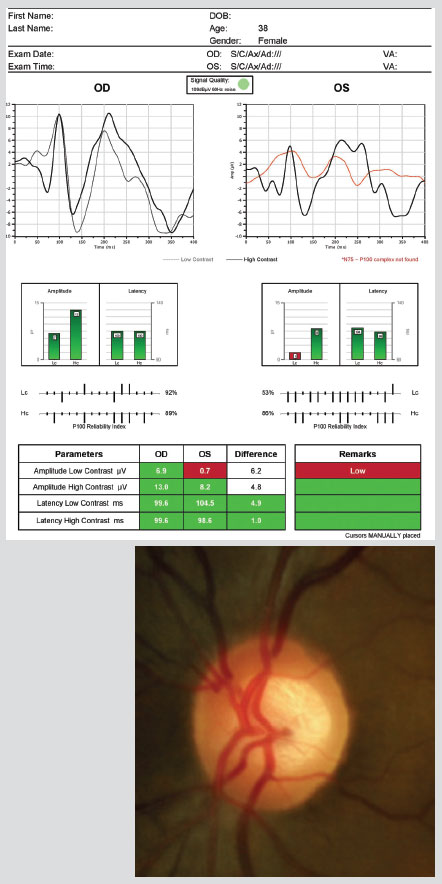
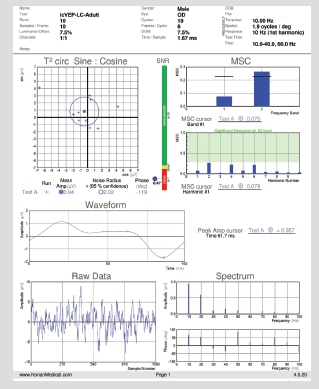
At right, the NOVA-VEP (Diopsys) uses a pattern-reversal stimulus protocol elicited by checkerboard stimuli. The test displays the waveform responses with traces on a two-dimensional graph. The low contrast trace represents the integrity of the magnocellular neural pathway and the high-contrast trace represents integrity of the parvocellular neural pathway. Although glaucoma-induced VEP abnormalities can exhibit the same variability inherent in other functional tests in patients with glaucoma, the following abnormalities are the typical findings in patients with glaucoma: Sponsel WE, Groth SL, Satsangi N, et al. Refined data analysis provides clinical evidence for central nervous system control of chronic glaucomatous neurodegeneration. Trans Vis Sci Technol. 2014 May;3(3):1. |
 |
Standard Automated Perimetry
The traditional method of measuring glaucoma-induced functional abnormality is standard automated perimetry (SAP). In fact, when most of us talk about functional changes in glaucoma, we are usually talking about changes in the visual field measured by an automated threshold perimeter. However, a disturbance of any test of visual function can indicate glaucoma-induced functional changes.
To begin the functional testing component of your glaucoma evalu ation, most optometrists perform a threshold visual field examination. Automated threshold perimeters measure the visual field by plotting the threshold luminescence value of the patient in various locations of the visual field. The luminescence of the light stimulus is represented by nonspecific units of measurement called decibels (dB).
Automated perimeters characterize specific parameters of the overall visual field status by the use of numbers called global indices. Two of the indices, mean deviation (MD) and pattern standard deviation (PSD), express the raw data generated by the instrument.
A visual field defect can be classified as mild, moderate or advanced based upon an abnormal mean deviation:
- Mild: 0.00dB through -5.99dB.
- Moderate: -6.00dB through -11.99dB.
- Advanced defect: Greater than -12.00dB.
Glaucoma produces several changes in the visual field, including a widespread, nondescript loss of retinal sensitivity. This diffuse loss of retinal sensitivity should be considered highly diagnostic of glaucoma when it is asymmetric and correlates with asymmetric changes in intraocular pressure or optic disc appearance.
In most cases, the loss of sensitivity occurs in characteristic patterns and locations (i.e., nasal step, arcuate scotoma, paracentral scotoma) that often correlate with changes in the optic nerve or retinal nerve fiber layer or both.
Remember, a threshold visual field examination can be normal in a patient with early glaucoma. To continue the diagnostic program, many optometrists now employ electrodiag-nostic vision testing to assist in their medical decision-making.
Visual Evoked Potential Tests
 |
| Retinal nerve fiber layer fallout with the left eye worse than the right. Glaucomatous optic atrophy is not measurable without an OCT scan. |
Recent research shows that in some patients, glaucoma-induced vision loss can be detected with visual evoked potential (VEP) testing before measurable visual field defects are detected.3
Evoked potential studies are recorded electrical responses to stimulation of a sensory organ. The VEP is an objective electric sign of visual pathway function and is based on the general principles of neural electrophysiology. A VEP test is classified as a sensory nerve conduction study; it measures the speed and strength of the evoked responses along the visual pathway.
Because its parameters are sensitive to abnormalities in the visual pathway, VEP testing can be used to evaluate the integrity of the afferent visual sensory system. Abnormal waveform peak latencies and wave shape amplitude help to identify pathologies in many locations ranging from the eye to the primary visual cortex.4
Modern VEP technologies are designed to measure retinal ganglion cell functional losses and, in particular, losses to the magnocellular pathway, which conveys low luminous contrast information. Detecting loss of low contrast function is thought to be of value in diagnosing early glaucomatous damage.5 Although not diagnostic of glaucoma in itself, abnormal VEP test results, in addition to other abnormal clinical findings, can assist in the often-difficult diagnosis of early glaucoma.5
I usually order a VEP test when performing a glaucoma evaluation. The first benefit associated with VEP testing occurs when the OCT test results don't match the visual field examination test results. In these cases, you are left with IOP or other clinical measures to make a decision. You can be guided one way or the other by using the VEP testing results. For example, if your OCT scan shows characteristic fallout of retinal nerve fiber layer but your visual field is normal, do you treat the patient, or do you follow up for signs of progression? Do you continue the diagnostic process and perform more functional testing and get more information? What if the OCT scan and the VEP were abnormal? Would that make a difference? Would you initiate treatment sooner? Would you follow more aggressively? Is the opposite true if the VEP test results are normal?
Diagnostic Sensitivity for Glaucoma• Cup-to-disc ratio = 56% Huang JY, Pekmezci M, Mesiwala N, et al. Diagnostic power of optic disc morphology, peripapillary retinal nerve fiber layer thickness, and macular inner retinal thickness in glaucoma diagnosis with fourier-domain optical coherence tomography. Journal of Glaucoma. 2011;20(2):87-94. |
What doctors need to see is that incorporating VEP test results can help answer these questions and can make a difference in how you treat the patient.
Note, all functional testing in patients with glaucoma can be variable; also, there are many patients with glaucoma who have normal VEP test results. Knowing that, you may consider performing electroretinography in addition to VEP testing to help detect early glaucoma.
VEP-Based Decision Making
Occasionally, we'll see patients who are initially identified as "glaucoma suspects" because of elevated intraocular pressures. These are the easiest patients to identify as glaucoma suspects, but we still must determine whether they actually have glaucoma. When structural testing and visual fields are inconclusive, visual evoked potential testing can help guide treatment decisions.
For example, a 63-year-old black woman was examined three times over the course of one month with intraocular pressure measurements in the mid-twenties at each visit. Her risk factors for glaucoma were race, age, elevated intraocular pressures and large optic cups.
Although her OCT testing confirmed the large optic cups, the neuroretinal rim was healthy in each eye and the retinal nerve fiber layer thickness was normal and symmetric. Threshold visual fields showed scattered paracentral scotomas, but there were no definite glaucomatous visual field defects. At this point, my structural evaluation told me that the eye was normal. My first functional vision test, the threshold visual field exam, said there might be a problem, but if so, it was mild. In this patient, I needed another functional test to provide more information. My first two diagnostic tests did not correlate. When that happens in my office, we usually go to the next functional vision test, and the next test is usually the VEP.
In this case, the patient's VEP was normal. That information, combined with the normal OCT scan, helped me to decide to not initiate treatment for glaucoma and to diagnosis the patient as a high-risk glaucoma suspect that will be re-evaluated at six-month intervals.
Electroretinography
Electroretinography testing evaluates the integrity of the retina. To best detect glaucoma-induced vision loss, a specialized pattern electroretinogram (pERG) protocol uses a contrast-reversing pattern for the stimulus to produce information about ganglion cell function.
A recent study suggests pERG testing detects glaucoma-induced functional abnormalities while retinal ganglion cells are still alive, several years before OCT testing reveals clinically significant fallout of the retinal nerve fiber layer or threshold perimetry detects a visual field defect.6
The pERG is used in a similar manner as the VEP test—it is an adjunct test of visual function. It is no better or worse than any other functional test and it is just as important as any other test. It is not standard of care; it is cutting-edge care. Because its clinical value is highest early in the natural history of glaucoma, pERG testing may have particular benefit in an evaluation of patients suspicious for developing glaucoma.
Pupillary Light Reflex Testing
Pupillary Light Reflex PathwayAfferent Neural Pathway |
The pupillary light reflex controls the diameter of the pupil in response to the intensity of light that falls on the retina. Normal pupils have an equal response to light stimulus. Light entering the eye produces pupillary constriction (the direct response) as well as constriction in the pupil of the unstimulated eye (the indirect response).
It is an objective sign of visual pathway function, and it can be used as a clinical test for the detection and quantification of abnormalities in the retina, optic nerve, optic chiasm, optic tract and the pretectal area of the midbrain. Testing pupillary reactivity involves comparing the velocity and amplitude of the pupillary responses.
In the pupillary light reflex pathway, the neural elements are separated into afferent and efferent conduction pathways. The goal of pupillary light reflex testing is to determine if there is a defect in either pathway.
Asymmetry in the pupillary light response is a relative afferent pupil-lary defect (RAPD). The manual testing for the detection of RAPD is performed by alternately illuminating each eye while comparing the velocity and amplitude of the pupillary responses. If asymmetry is detected, neutral density filters in 0.3 logarithmic steps aid in quantification of RAPD. The size of the RAPD can be quantified by the density of the filter required to balance the response of each eye.7
Because early glaucomatous damage to the visual system is often asymmetric, patients with early glaucoma may demonstrate an RAPD on pupillary light reflex testing. Unfortunately, manual detection of a subtle RAPD can be challenging. For more accurate and objective results, many doctors prefer using computer-assisted automated pupillometry.
Color Vision Examination
Loss of chromatic discrimination (i.e., dyschromatopsia) has been reported in patients with glaucoma for more than 100 years.8 Modern research shows color vision defects may precede visual field defects in many patients with glaucoma. Although 20% to 40% of patients with glaucoma have normal color vision, most do not.8 Prevalence estimates for the different types of color vision defects found in the dyschro-matopsia of glaucoma are:8
- 30% to 50% blue-yellow defects.
- 20% to 30% unspecified loss of chromatic discrimination.
- 5% red-green defects.
Testing color vision is an important step in detecting the earliest signs of glaucoma. However, color vision abnormalities are not specific and can occur in a wide variety of ophthalmologic and neurologic conditions. Diseases that result in a loss of foveal function, optic nerve disease, retinal dystrophies, neurologic disease, neurologic injury and visual field defects can be signaled by color vision abnormalities as well.
 |
Isolated-Check VEP• Preferentially tests the "on" and "off" subdivisions of the magnocellular neural pathway.• Test strategy present 10 two-second runs. • Runs are compared for consistency, outliers are repeated, and the mean of the runs is presented. • This very short test time may be better for children and the elderly. • EvokeDx features an infrared gaze tracker to improve the reliability of the results. • The organic LED removes any unwanted luminance artifact in the screen displays. |
Like most acquired color vision defects, the loss of chromatic discrimination found in the dyschromatopsia of glaucoma is primarily blue-yellow in nature. The predominance of these tritan-like defects has several possible explanations:
- Blue-yellow cones and their neuronal connections are more fragile than red-green cones and are less able to resist the effects of elevated intraocular pressure.
- Blue-yellow cones are more susceptible to the effects of elevated IOP and are selectively damaged because they have larger receptive fields than red-green cones and have a unique morphology and connectivity to second order neurons.
- Blue-yellow cones are fewer in number and there is little overlap between adjacent receptive fields. Because of this, the loss of a small number of blue-yellow ganglion cells may produce a preferential impairment of blue-yellow discrimination compared with red-green, even if the proportion of damaged axons is the same for both the magnocellular pathway (red-green channel) and the koniocellular pathway (blue-yellow).
In addition to a loss of chromatic discrimination, recent investigations have shown that color contrast thresholds are elevated in patients with glaucoma.9 However, just like the other tests of visual function, there are no rules about glaucoma-induced color vision defects. Some patients with glaucoma never develop color vision defects, while others develop the dyschromatopsia of glaucoma only in the advanced stages of the disease.9
There are several ways to measure a person's vision, and glaucoma can produce abnormalities in all of them. Although threshold visual field testing is the standard method of evaluating vision loss, new functional testing has proven that, in many patients, glaucoma-induced vison loss can be detected with other technologies before visual field loss can be detected on an automated perimeter. Earlier detection of glaucoma is possible if we used all the available diagnostic tests. It's up to us.
Our primary responsibility as optometrists is to protect, preserve and enhance our patient's vision. Because undiagnosed glaucoma remains a common cause of preventable blindness, we still have lots of work to do. Fortunately, new science and technology is forging a new frontier in early glaucoma detection.
The science demonstrates that we can't rely on a visual field examination alone, and the technology has begun to follow that lead. This new class of instruments provides the clinical measurements of visual function necessary to diagnose early glaucoma and initiate treatment before permanent vision loss occurs.
Dr. Thomas practices in Dallas, Texas, is the owner of BMG Consulting Group and the founder of DecisionmakerPLUS.com.
References
- Tielsch J, Sommer A, Katz J, et al. Baltimore Eye Survey. JAMA. 1991 Jul;266(3):369-74.
- Malik R, Swanson W, Garway-Heath D. The ‘structure-function' relationship in glaucoma—past thinking and current concepts. Clin Exp Ophthalmol. 2012 May-Jun:40(4):369-80.
- Punjab O, Lin S, Stamper R. Advances in mapping the glau-comatous visual field: from confrontation to multifocal visual evoked potentials. The Internet Journal of Ophthalmology and Visual Science. 2006;4(1).
- Miller N, Newman N, Biousse V, Kerrison J. Examination of the vision sensory system. In: Walsh and Hoyt's Clinical Neuro-Ophthalmology: The Essentials. 2nd ed. Philadelphia: Lippincott Williams & Wilkins; 2008:39-41.
- Zemon V, Tsai JC, Forbes M, et al. Novel electrophysiological instrument for rapid and objective assessment of magnocel-lular deficits associated with glaucoma. DocOphthalmol. 2008 Nov;117(3):223-43.
- Banitt M, Ventura L, Feuer W, et al. Progressive loss of retinal ganglion cell function precedes structural loss by several years in glaucoma suspects. Invest Ophthalmol Vis Sci. 2013 March;54(3):2346-52.
- Younis A, Eggenberger E. Correlation of relative afferent pupillary defect and retinal nerve fiber layer loss in unilateral or asymmetric demyelinating optic neuropathy. Invest Ophthalmol Vis Sci. 2010 Aug;51:4013-6.
- Pacheo-Cutilla M, Edgar D. Acquired colour vision defects in glaucoma. Br J Ophthalmol. 1999;83:1396-1402.
- Niwa Y, Muraki S, Naito F, Minamikawa T. Evaluation of acquired color vision deficiency in glaucoma using the Rabin Cone Contrast Test. Invest Ophthalmol Vis Sci. 2014 Oct;55:6686-90.