Guidelines on Glaucoma Progression
Monitoring patients is key to providing appropriate treatment.
Goal Statement:
A vital aspect of caring for patients with glaucoma is tracking the disease's development. This course reviews how to perform a comprehensive glaucoma evaluation, including IOP measurements and visual fields tests, as well as how to respond to glaucomatous changes.
Faculty/Editorial Board:
Michael Cymbor, OD
Credit Statement:
This course is COPE approved for 2 hours of CE credit. COPE ID 46640-GL. Please check your state licensing board to see if this approval counts toward your CE requirement for relicensure.
Joint-Sponsorship Statement:
This continuing education course is joint-sponsored by the Pennsylvania College of Optometry.
Disclosure Statement:
Dr. Cymbor is on the speaker's bureau for Optovue and is an advisor for Eye IC.
As optometrists, much of our energy is devoted to the diagnosis of glaucoma, and rightfully so. It is, after all, the second leading cause of blindness in the United States and the world.1 Glaucoma is a degenerative optic neuropathy characterized by a progressive loss of retinal ganglion cells, leading to a loss of visual function. In today's optometric environment, with so many available treatment options, we are charged with doing more than simply prescribing a prostaglandin and wishing the patient well. The detection and monitoring of glaucomatous progression is critical both to our patient's health and our discipline.
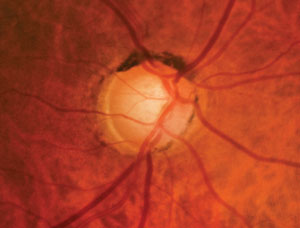 |
| Fig. 1. Using modern analysis technologies, we were able to trace this patient's progression with enough time to delay development. Two decades ago, optometrists evaluated glaucomatous progression primarily using visual field tests. |
In 2004, our practice diagnosed a 61-year-old white male patient with ocular hypertension, based on intraocular pressure (IOP) of 23mm Hg OD and 25mm Hg OS. From 2004 to 2011, his peak IOP was measured at 25mm Hg OD and 29mm Hg OS, while his mean IOP was 19.8mm Hg OD and 21.6mm Hg OS. His pachymetry is 502µm OD and 518µm OS. From 2004 to 2011, his visual fields were clean and his cup-to-disc ratios were 0.6/0.7 OD and 0.5/0.5 OS (Figures 1 and 2). His nerve fiber layer OCT showed some possible thinning around 8:00 in the right eye but was stable from 2010 to 2011, while his ganglion cell complex (GCC) showed an inferior defect in the right eye (Figure 3). Retinal tomography started to show infratemporal changes in 2011. In 2012, his glaucoma hemifield test results in the right eye went from "borderline" to "outside normal limits," and his visual field GPA1 (event analysis) went from "no progression detected" to "possible progression" (Figure 4). In 2012, we started treatment with Lumigan 0.01% OU.
Determining Progression
Two decades ago, optometrists were evaluating glaucomatous progression primarily using visual field tests and, to a lesser extent, photography. One decade ago, we were employing a combination of visual fields and structural testing of the optic nerve head/retinal nerve fiber layer (RNFL), such as confocal laser scanning tomography (HRT), scanning laser polarimetry (GDx) or optical coherence tomography (OCT). How are we evaluating risk factors and determining glaucomatous progression today? This article will highlight current concepts in managing glaucomatous progression.
Pressure Points
IOP remains the most prominent and consistent risk factor for glaucomatous progression. This was confirmed in the Ocular Hypertensive Treatment Study (OHTS), Early Manifest Glaucoma Trial (EMGT), Advanced Glaucoma Intervention Study (AGIS) and the Collaborative Normal Tension Glaucoma Study (CNTG), which all show lowering IOP delays or prevents glaucomatous progression or conversion.2-5
Peak IOP might be the most important factor in determining progression, but mean IOP and IOP fluctuation are also important.6 However, there is one confounding factor—investigators estimate that 67% of peak IOP occurs outside of typical office hours.7 This can be quite confusing when dealing with a patient who is progressing more rapidly than expected.
Checking Pressure
The most common method of obtaining IOP is Goldmann tonometry. Goldmann is relatively inexpensive and straightforward to perform.
However, the inaccuracy and imprecision of the instrument are well documented.8 For example, Goldmann tonometry may be inaccurate with thick or thin corneas, patients who've undergone corneal surgeries, corneal edema or high corneal astigmatism.9 There may be inconsistent readings between doctors and between technicians. Eyelid squeezing and breath holding may influence the readings.9 Despite these challenges, Goldmann tonometry is universally accepted as the primary method to gather IOP in glaucoma management because of cost, convenience and general practice patterns.
Noncontact tonometry (NCT) is another method of obtaining IOP. The NCT creates a burst of air, and the tonometer measures the cornea's resistance. Generally, researchers have found good agreement between NCT and Goldmann.10 However, the relationship between increasing and decreasing corneal thickness and increasing and decreasing IOP can be magnified with NCT.11
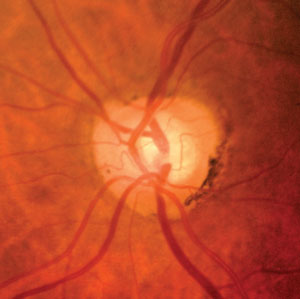 |
| Fig. 2. The fact that this 61-year-old patient progressed within one year in the right eye shows us he is at significant risk for future progression. |
The Tono-Pen, a descendant of the Mackay-Marg tonometer, is a handheld tonometer option. However, early models were limited by inadequate sampling rates. For instance, a study comparing Goldmann with the Tono-Pen XL (Reichert) concluded the Tono-Pen XL should not be used as a substitute for Goldmann in the management of patients with glaucoma or ocular hypertension.12 These sampling rates have improved for the newest device of this type called the Avia (Reichert); however, another study questions whether the Tono-Pen Avia can be used interchangeably with Goldmann in monitoring glaucoma patients.13
The Pascal tonometer (Zeimer) uses a high sensitivity pressure transducer that measures the countervail of the cornea when one gram of pressure is applied. Although the Pascal is less studied than some of the other methods, investigators think it may reduce operator bias by directly giving a pressure number.14 It also can report the ocular pulse amplitude, which investigators suspect may be lower in glaucoma patients compared with non-glaucoma patients.14
The iCare tonometer (iCare) is based on a rebound measuring principle, in which a light weight probe is used to make momentary contact with the cornea. The instrument measures probe deceleration and contact time. The iCare is well tolerated and its accuracy is thought to correlate well with Goldmann.15
Another method of obtaining IOP is the Ocular Response Analizer (ORA) (Reichert). The ORA uses a much longer pulse than NCT technology.16 Investigators believe the ORA correlates well with Goldmann but is less influenced by corneal properties.17
Whatever method is chosen, IOP measurements for each patient should be consistent from visit to visit so as to minimize apples-to-oranges IOP comparisons.
According to a recent publication, no perfect tonometer exists and clinicians must choose which to use, balancing accuracy, precision, convenience and cost.18
The Future
The problem with IOP measurements is that they provide an extremely small number of data points by which we make vital treatment decisions. This should make all glaucoma clinicians feel somewhat ill-equipped.
Twenty-four hour IOP monitoring has the potential to significantly disrupt the way we manage glaucoma. In fact, at last year's Glaucoma 360 conference, Robert Weinreb, MD, said "the most disruptive event for glaucoma practitioners, and the most transformative event for glaucoma patients within the next five years, is 24-hour IOP monitoring."19
One recent contact lens sensor 24-hour IOP study found that contact lens sensor measurements may be useful for the detection of sleep-induced IOP changes.20 We may soon see a parade of 24-hour studies elucidating what is happening with our patients' IOPs in those vast times between pressure checks.
Serial Photography
Serial optic disc and nerve fiber layer photography are established methods of monitoring glaucomatous structural progression and are arguably still considered the standard of care.21 Optic nerve progression can include new or increased neuroretinal rim thinning, notching, excavation and nerve fiber layer defects.22 Serial optic nerve photography can also detect optic nerve hemorrhages and B zone peripapillary atrophy changes, which are both known risk factors for optic nerve progression.23,24 Serial photography can be used to evaluate optic nerve photos taken from different cameras so clinicians often have years of images.
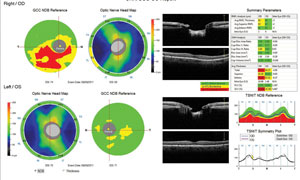 |
| Fig. 3. This OCT shows our patient's nerve fiber layer displays thinning around 8:00 while his ganglion cell complex showed an inferior defect, both in the right eye. |
But this method can be time consuming and may require a high degree of skill. Optic nerve and nerve fiber layer assessment can be qualitative and subjective. Intraobserver and interobserver agreement among glaucoma specialists is only slight to fair, and agreement among general ophthalmologists is poor.25-29 It can be challenging to detect diffuse glaucomatous progression of the nerve fiber layer and neuroretinal rim employing photography.
At least one technology attempts to improve the process of using serial photography to detect glaucomatous progression—a technique called flicker comparison.30,31 This involves taking two images, obtained at different times, and rapidly projecting them one atop the other. In the flickered images, unchanged areas appear stable, whereas changes in the optic nerve appear as movement. This concept is similar to the process of animation in that slight differences in sequential pictures give the illusion of movement when alternated or "flickered" at a certain rate. This is a commercially available, cloud-based software that can use any digital optic nerve photo. Flicker comparison has the potential to improve accuracy and may be more sensitive than standard serial photography at detecting disc hemorrhages, peripapillary progression and retinal blood vessel positional shifts.32-35
Other Imaging Technologies
Because of the weaknesses in serial photography mentioned above, there is a need for objective and quantitative imaging analysis. The two main methods today are HRT and OCT.
• HRT. Confocal laser scanning tomography can accurately detect glaucomatous structural changes to the optic nerve, often before field changes.36-42 This technology is generally understood to have the most well-developed and most tested progression analysis among all optical imaging devices.43
Years of confocal progression research culminates in the ancillary OHTS study, which compared the rate of structural change in ocular hypertensive eyes that do or do not develop primary open-angle glaucoma.44 This study is significant because the median length of follow-up was 11 years for non-POAG converting patients and 5.6 years for POAG converters. This represents the longest follow-up of the largest group of ocular hypertensive subjects using optical imaging instruments. Eye care specialists will not see anything close to those follow-up periods with Fourier-domain OCT technology for many years to come.
The study's authors made the following conclusions:44
- The rate of neuroretinal rim loss is five times faster in eyes in which POAG developed compared with eyes in which it did not.
- Eyes that developed POAG changed at a rate of 0.99%/year vs. 0.18% for eyes that did not.
- The fastest neuroretinal rim change is in the inferotemporal sector.
- There was a weak association with central corneal thickness (CCT) and the rate of neuroretinal rim loss.
This study verifies that measuring the rate of structural change using HRT technology provides useful information for the clinical management of ocular hypertensive patients.44 It also clarifies something HRT users have long known: that glaucomatous structural change, as determined by HRT technology, often precedes visual field loss.44
Despite the impressive credentials, advancements in confocal tomography have slowed in favor of the time-domain (TD-OCT) technology.
• OCT. TD-OCT started promisingly, but weaknesses soon emerged, including slow scanning speed, artifacts, limited axial resolution and inadequate reproducibility. In addition, TD-OCT RNFL progression was hampered by a lack of image registration with scan misalignment, significantly altering results.45 All of these issues have been improved with spectral-domain OCT (SD-OCT).46,47
Four of the current commercially available SD-OCT devices in the United States are:
- The Spectralis (Heidelberg Engineering).
- The Cirrus (Carl Zeiss Meditec).
- The Avanti (Optovue).
- The 3D OCT-2000 (Topcon).
The Spectralis SD-OCT obtains OCT scans with a speed of 40,000 A-scans/second. The device has an axial resolution of 3.9µm, with a transverse resolution of 14µm and a scan depth of 1.9mm.48 The Cirrus operates at 27,000 A-scans/second, has an axial resolution of 5µm, with a transverse resolution of 15µm and a scan depth of 3mm.49 The Avanti SD-OCT scans at a speed of 70,000 A-scans/second, has an axial resolution of 5µm (3µm digital), with a transverse resolution of 15µm and a scan depth of 3mm.50 The 3D OCT-2000 scans at a speed of 27,000 A-scans/second. The device has an axial resolution of 5µm to 6µm, with a transverse resolution of less than 20µm and a scan depth of 2.3mm.51
The principles of imaging acquisition are similar for each of these devices and involve the use of a scanning laser diode to provide high-resolution images of neuroretinal tissue through the detection of the echo optical signal measured by the spectral/Fourier domain technique.52
Previous studies demonstrated that measurements taken from these instruments show good clinical–histological correlations.53-55
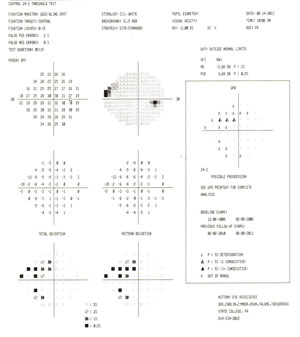 |
| Fig. 4. Our patient's HRT3 showed infratemporal changes in 2011. In 2012, his glaucoma hemifield test results OD went from "borderline" to "outside normal limits," and this visual field GPA1 (event analysis) went from "no progression detected" to "possible progression." These technologies, combined, helped us determine a course of early treatment. |
SD-OCT is more sensitive than TD-OCT in detecting glaucomatous progression in the retinal nerve fiber layer.56 The most common pattern of RNFL progression, a study shows, is widening of RNFL defects (85.7%), followed by development of new defects (17.9%) and deepening of RNFL defects (7.1%).56 The inferotemporal meridian was the most common location where RNFL change was detected. Other studies have confirmed the accuracy of using SD-OCT to monitor changes in the RNFL.57-60
Doctors generally accept that glaucoma causes thinning to retinal tissue within the macular area and that macular scans are complementary to RNFL scans.61-63 Some studies seem to indicate that macular scans in glaucoma may even detect damage prior to RNFL OCT and visual fields.64,65 The practice of using the macular region to monitor glaucomatous progression is still emerging.
While SD-OCT is enjoying widespread acceptance, challenges in using the technology for the monitoring of glaucomatous progression remain, in that we are just beginning to see published studies on the validation of these statistical progression analyses. No evidence supports the use of one device over another in detection and management of glaucomatous progression.66 Even though many clinicians have employed SD-OCT technology for years, SD-OCT research for the management of glaucoma progression is still in its infancy.
Visual Fields
The main goal in the management of glaucoma is to preserve visual function. The primary method of measuring visual function is the automated visual field. Automated visual fields enjoy widespread use and are found in the most eye care providers' offices.67,68 Visual field limitations include being subjective, time-consuming and sometimes unreliable.
There are several ways to improve reliability, which will then help to more accurately assess progression.43 These include:
- Explain to the patient the purpose of the test.
- The technician should be in close proximity to the patient to give advice and encouragement.
- If possible, a 1:1 technician to patient ratio should be kept.
- The technician should give feedback to the doctor about the patient's performance.
- The technician should explain to the patient that they are not expected to see all the lights.
Between 2001 and 2009, visual field usage decreased by 44%, while other forms of testing increased.69 While eye care providers are performing less visual field testing now than in the past, some authorities are recommending running more.43 The World Glaucoma Assosciation's 2011 Consensus statement recommends at least two visual fields in the first six months and at least two more in the next 18. This equals four fields in the first two years and possibly six if the patient is at risk for rapid progression. Rapid progression is defined as 2dB/year or greater.43
Many doctors employ the 24-2 testing pattern for monitoring glaucoma, while some prefer the 30-2. Both testing strategies have test points that are six degrees apart. The OHTS found that 12% of the patients that reached a visual field endpoint on the 30-2 strategy would not have been found on the 24-2 testing strategy.70 Conversely, one study found more glaucomatous damage on the 10-2 test than on the 30-2 test in approximately 10% of their patients with suspected or early glaucoma.71 This is because there are only four central points tested in both the 30-2 and 24-2. Early glaucomatous damage is easily missed with these two testing strategies. Also, some macular ganglion cells may be preserved until later in the disease process.72
Arcuate defects of the RNFL produce a range of glaucomatous VF defects. Sometimes these defects are best identified on the 30-2 test, some on the 24-2 and some on 10-2. Each of these tests can miss damage that others pick up. Clearly, eye care practitioners are looking for a better testing strategy that more often correctly identifies glaucomatous visual field defects.
In the past, the process of finding visual field glaucomatous progression was limited to serial visual field analysis. This process is cumbersome, and the agreement between glaucoma specialists is poor.73 Better methods of determining glaucomatous visual progression are crucial, as many of our patients will experience progression if given enough time. In the EMGT, 59% of well controlled glaucoma patients progressed.74 Fortunately, we now have visual field software analysis to help sift through numerous visual fields, including: glaucoma progression analysis (GPA1) and visual field index (GPA2 or VFI) from Carl Zeiss Meditec and the Octopus (Haag-Streit) cluster trend analysis with event analysis (CTA) and corrected cluster trend analysis (CCTA).
Visual field progression software comes in event analysis and trend analysis. After establishing a baseline, event analysis looks at every visual field to see if a reduction is more than just variability on a point-by-point basis. Event analysis attempts to answer the question, "Did the field progress or did it not?" Event-based progression analysis was used in the EMGT, the AGIS and the Collaborative Initial Glaucoma Treatment Study (CIGTS).74-76 GPA1 uses event-based criteria established by the EMGT, in which a depression of three of the same points on two consecutive fields will be marked as "possible progression" and "likely progression" if those same points are on three consecutive fields. The Octopus CTA also uses event analysis. Trend analysis converts the field to a linear regression graphical representation, which may better allow clinicians to view the rate of change over time. If the patient has fields in a two-year period, the software will also predict future progression. The rate of field change over time may be expressed in dB/year. GPA2 uses center weighted points and is less influenced by media opacities such as cataracts.77 In addition to GPA2, the Octopus CCTA uses trend analysis.
Short-wavelength perimetry (SWAP) uses a blue stimulus on a yellow background. Some have reported the detection of visual field defects prior to detection with standard automated perimetry (SAP).78,79 Numerous subsequent studies have disproved this idea, and SWAP is now considered less valuable in the detection and monitoring of glaucomatous visual field progression.43
Remember to discard and repeat unreliable visual fields, as they may potentially obfuscate true glaucomatous progression and delay more aggressive management. It may also be a good idea to reset field baselines whenever treatment is changed.
At this time, no consensus exists on the best or most appropriate method of monitoring glaucomatous field progression.43
Greater sensitivity may be possible using a visual evoked potential (VEP) test, which measures the objective functional response of the visual pathway and may help identify early glaucomatous defects.80 Also, research emphasizes the importance of measuring CCT.2 Today, 69% of ODs employ this technology.67
Our Patient
From 2012 to 2013, his peak IOP was 21mm Hg OU, and his mean IOP was 15.9mm Hg OD and 16mm Hg OS. His treated mean IOP exhibited a 20% reduction OD and 26% OS. His visual fields continued to progress in his right eye, as seen with GPA2 or visual field index (VFI), but remained stable in the left eye. The fact that he progressed within a year in the right eye, even with a 20% IOP reduction, shows he is at significant risk for future progression. One of the highest risks for future progression is past progression.81
In 2013, we added Combigan (Allergan) BID and between then and now, his peak IOP has been 13mm Hg OD and his mean IOP 11.4mm Hg OD. His left eye's peak IOP is 13mm Hg and mean is 12.5mm Hg. His mean IOP from baseline experienced a 42% reduction in both eyes.
His visual fields and all structural testing are stable.
Fortunately, his visual acuity remains 20/20 and he remains asymptomatic. We are sending him for SLT in the near future.
We will continue to watch him closely and will consider a trabeculectomy in the right eye with evidence of further progression.
Never before have we had such an array of glaucoma diagnostic tools at our fingertips. It is incumbent upon us to stay abreast of advances in technology to provide the best possible care for our patients.
Dr. Cymbor is a partner at Nittany Eye Associates located in State College, Pa. He is also a member of the Optometric Glaucoma Society.
References
- Quigley H, Broman A.The number of people with glaucoma worldwide in 2010 and 2020. British journal of ophthalmology 2006;90(3):262-7.
- Brandt J, Beiser J, Kass M, et al. Ocular Hypertension Treatment Study (OHTS) Group. Central corneal thickness in the ocular hypertension treatment study.Ophthalmology 2001;108(10): 1779-88.
- Heijl A, Leske M, Bengtsson B, et al. Reduction of intraocular pressure and glaucoma progression: results from the early manifest glaucoma trial. Archives of Ophthalmology 2002;120(10):1268-79.
- Group, C.N.T.G.S. Comparison of glaucomatous progression between untreated patients with normal-tension glaucoma and patients with therapeutically reduced intraocular pressures. Am J Ophthalmol. 1998;126(4):487-97.
- AGIS Investigators. The Advanced Glaucoma Intervention Study: 7. The relationship between control of intraocular pressure and visual field deterioration. Am J Ophthalmol. 2000;130(4):429-40.
- De Moraes C, Juthani V, Liebmann J, et al. Risk Factors for Visual Field Progression in Treated Glaucoma. Arch Ophthalmol. 2011;129(5):562-68.
- Mosaed S, Liu J, Weinreb R. Correlation between office and peak nocturnal intraocular pressures in healthy subjects and glaucoma patients. Am J Ophthalmol. 2005 Feb;139(2):320-4.
- Whitacre M, Stein R. Sources of error with use of Goldmann-type tonometers. Surv Ophthalmol. 1993;38:1-30.
- Whitacre M, Stein R. Sources of error with use of Goldmann-type tonometers. Survey of Ophthalmology. 1993;38(1):1-30.
- Cook J, Botello A, Elders A, et al. Surveillance of Ocular Hypertension Study Group. Ophthalmology. 2012 Aug;119(8):1552-7
- Tonnu A, Ho T, Newson T, et al. The influence of central corneal thickness and age on intraocular pressure measured by pneumotonometry, non-contact tonometry, the Tono-Pen XL, and Goldmann applanation tonometry. Br J Ophthalmol. 2005;89(7):851-4.
- Carrim Z, Lavy T. Goldmann tonometry versus the Tono-Pen XL for intraocular pressure measurement: An evaluation of the potential impact on clinical decision making in glaucoma. Ophthalmic Physiol Opt. 2009;29(6):648-51.
- Bhartiya S, Bali S, Sharma R, et al. Comparative evaluation of TonoPen AVIA, Goldmann applanation tonometry and non-contact tonometry. International Ophthalmol. 2011. Aug;31(4):297-302.
- Stalmans I, Harris A, Vanbellinghen V, et al. Ocular pulse amplitude in normal tension and primary open angle glaucoma. J Glaucoma. 2008 Aug;17(5):403-7.
- Brusini P, Salvetat M, Zeppieri M, et al. Comparison of ICare tonometer with Goldmann applanation tonometer in glaucoma patients. J Glaucoma. 2006 Jun;15(3):213-7.
- Luce D. Determining in vivo biomechanical properties of the cornea with an ocular response analyzer. J Cataract Refract Surg. 2005 Jan;31(1):156-62.
- Medeiros F, Weinreb R. Evaluation of the influence of corneal biomechanical properties on intraocular pressure measurements using the ocular response analyzer. J Glaucoma. 2006;15(5):364-70.
- Okafor K, Brandt J. Measuring intraocular pressure. Curr Opin Ophthalmol. 2015. Mar;26(2):103-9.
- Glaucoma 360 Conference, June 2014, San Francisco, CA.
- Mansouri K, Liu J, Weinreb R, et al. Analysis of continuous 24-hour intraocular pressure patterns in glaucoma. Invest Ophthalmol Vis Sci. 2012;53(13):8050-6.
- Spaeth G, Reddy S. Imaging of the optic disk in caring for patients with glaucoma: ophthalmoscopy and photography remain the gold standard. Survey of Ophthalmology. 2014;59:454-8.
- Lloyd M, Mansberger S, Fortune B, et al. Features of optic disc progression in patients with ocular hypertension and early glaucoma. J Glaucoma. 2013;22:343–8.
- Niyadurupola N, Broadway D. Optic disc hemorrhages and progression in glaucoma. Expert Review of Ophthalmology. 2010 Oct;5(5):637-43.
- Lee E, Kim T, Weinreb R, et al. ß-zone Parapapillary atrophy and the rate of retinal nerve fiber layer thinning in glaucoma. Invest Ophthalmol Vis Sci. 2011;52: 4422–7.
- Jampel H, Friedman D, Quigley H. Agreement among glaucoma specialists in assessing progressive disc changes from photographs in open-angle glaucoma patients. Am J Ophthalmol. 2009;147(1):39–44.
- Azuara-Blanco A, Katz L, Spaeth G, et al. Clinical agreement among glaucoma experts in the detection of glaucomatous changes of the optic disk using simultaneous stereoscopic photographs. Am J Ophthalmol. 2003;136:949–50.
- Coleman A, Sommer A, Enger C, et al. Interobserver and intraobserver variability in the detection of glaucomatous progression of the optic disc. J Glaucoma. 1996;5:384-9.
- Breusegem C, Fieuws S, Stalmans I, et al. Agreement and accuracy of non-expert ophthalmologists in assessing glaucomatous changes in serial stereo optic disc photographs. Ophthalmology. 2011;118:742–6.
- Fremont A, Lee P, Mangione C, et al. Patterns of care for open-angle glaucoma in managed care. Arch Ophthalmol. 2003;121(6):777-83.
- Bengtsson B, Krakau C. Flicker comparison of fundus photographs: a technical note. Acta Ophthalmol. 1979 Jun;57(3):503-6.
- Heijl A, Bengtsson B. Diagnosis of early glaucoma with flicker comparisons of serial disc photographs. Invest Ophthalmol Vis Sci. 1989 Nov;30(11):2376-84.
- Cymbor M, Lear L, Mastrine M. Concordance of flicker comparison versus side-by-side comparison in glaucoma. Optom J Am Optom Assoc. 2009;80(8):437–41.
- Syed Z, Radcliffe N, De Moraes C, et al. Automated alternation flicker for the detection of optic disc haemorrhages. Acta Ophthalmol. 2012;90(7):645–50.
- Vanderbeek B, Smith S, Radcliffe N. Comparing the detection and agreement of parapapillary atrophy progression using digital optic disk photographs and alternation flicker. Arch Clin Exp Ophthalmol. 2010;248:1313–7.
- Radcliffe N, Smith S, Syed Z, et al. Retinal blood vessel positional shifts and glaucoma progression. Ophthalmology. 2014 Apr;121(4):842-8.
- Chauhan B, McCormick T, Nicolela M, LeBlanc R. Optic disc and visual field changes in a prospective longitudinal study of patients with glaucoma: comparison of scanning laser tomography with conventional perimetry and optic disc photography. Arch Ophthalmol. 2001;119:1492-9.
- Tan J, Poinoosawmy D, Hitchings R. Tomographic identification of neuroretinal rim loss in high-pressure, normal-pressure, and suspected glaucoma. Invest Ophthalmol Vis Sci. 2004;45:2279-85.
- Bowd C , Zangwill L, Medeiros F, et al. Confocal scanning laser ophthalmoscopy classifiers and stereophotograph evaluation for prediction of visual field abnormalities in glaucoma-suspect eyes. Invest Ophthalmol Vis Sci. 2004;45:2255-62.
- Kamal D, Viswanathan A, Garway-Heath D, et al. Detection of optic disc change with the Heidelberg retina tomograph before confirmed visual field change in ocular hypertensives converting to early glaucoma. Br J Ophthalmol. 1999;83:290-4.
- Tan J, Hitchings R. Optimizing and validating an approach for identifying glaucomatous change in optic nerve topography. Invest Ophthalmol Vis Sci. 2004;45(5):1396-403.
- Kamal D, Garway-Heath D, Hitchings R, Fitzke F. Use of sequential Heidelberg retina tomograph images to identify changes at the optic disc in ocular hypertensive patients at risk of developing glaucoma. Br J Ophthalmol. 2000;84(9):993-8.
- Patterson A, Garway-Heath D, Strouthidis N, et al. A new statistical approach for quantifying change in series of retinal and optic nerve head topography images. Invest Ophthalmol Vis Sci. 2005;46(5):1659-67.
- Weinreb R, Garway-Heath D, Leung C, et al. Progression of Glaucoma—Consensus Series Book 8. Amsterdam: Kugler Publications: 2011:9-50.
- Zangwill L, Jain S, Dirkes K, et al. Confocal Scanning Laser Ophthalmoscopy Ancillary Study to the Ocular Hypertension Treatment Study. The rate of structural change: the confocal scanning laser ophthalmoscopy ancillary study to the ocular hypertension treatment study. Am J Ophthalmol. 2013 Jun;155(6):971-82.
- Vizzeri G, Bowd C, Medeiros F, et al. Effect of improper scan alignment on retinal nerve fiber layer thickness measurements using Stratus optical coherence tomograph. J Glaucoma. 2008;17:341–9.
- Wojtkowski M, Srinivasan V, Ko T, et al. Ultrahigh-resolution, high-speed, Fourier domain optical coherence tomography and methods for dispersion compensation. Opt. Exp. 2004;12:2404–22.
- González-García A, Vizzeri G, Bowd C, et al. Reproducibility of RTVue retinal nerve fiber layer thickness and optic disc measurements and agreement with Stratus optical coherence tomography measurements. Am J Ophthalmol. 2009;147(6):1067–74.
- Menke M, Dabov S, Knecht P, et al. Reproducibility of retinal thickness measurements in healthy subjects using spectralis optical coherence tomography. Am J Ophthalmol. 2009;147(3):467-472.
- Sung K, Kim D, Park S, et al. Comparison of retinal nerve fiber layer thickness measured by Cirrus HD and Stratus optical coherence tomography. Ophthalmology. 2009;116(7):1264-70.
- Lin A, Olsen M, Watkins J, Chen C. Spectral-domain optical coherence tomography with split-spectrum amplitudinal decorrelation angiography: a new way to detect retinal vascular anomalies without dye injection. Invest Ophthalmol Vis Sci. 2014;55(13):217.
- Pierro L, Gagliardi M, Iuliano L, et al. Retinal nerve fiber layer thickness reproducibility using seven different OCT instruments RNFL thickness assessment by OCT instrument model. Invest Ophthalmol Vis Sci. 2012;53(9):5912-20.
- Drexler W, Fujimoto J. State-of-the-art retinal optical coherence tomography. Prog Retin Eye Res. 2008;27(1):45–88.
- Blumenthal E, Parikh R, Pe'er J, et al. Retinal nerve fibre layer imaging compared with histological measurements in a human eye. Eye (Lond). 2009;23(1):171–5.
- Chen T, Cense B, Miller J, et al. Histologic correlation of in vivo optical coherence tomography images of the human retina. Am J Ophthalmol. 2006;141(6):1165–8.
- Strouthidis N, Grimm J, Williams G, et al. A comparison of optic nerve head morphology viewed by spectral domain optical coherence tomography and by serial histology. Invest Ophthalmol Vis Sci. 2010;51(3):1464–74.
- Leung C, Chiu V, Weinreb R, et al. Evaluation of retinal nerve fiber layer progression in glaucoma: a comparison between spectral-domain and time-domain optical coherence tomography. Ophthalmology. 2011;118:1558–62.
- Wessel J, Horn F, Tornow R, et al. Longitudinal analysis of progression in glaucoma using spectral-domain optical coherence tomography. Invest Ophthalmol Vis Sci. 2013;54(5):3613–20.
- Miki A, Medeiros F, Weinreb R, et al. Rates of retinal nerve fiber layer thinning in glaucoma suspect eyes. Ophthalmology. 2014;121(7):1350–8.
- Na J, Sung K, Baek S, et al. Progression of retinal nerve fiber layer thinning in glaucoma assessed by cirrus optical coherence tomography-guided progression analysis. Curr Eye Res. 2013;38(3):386–95.
- Tenkumo K, Hirooka K, Baba T, et al. Evaluation of relationship between retinal nerve fiber layer thickness progression and visual field progression in patients with glaucoma. Jpn J Ophthalmol. 2013;57(5):451–6.
- Tan O, Chopra V, Lu A, et al. Detection of macular ganglion cell loss in glaucoma by Fourier-domain optical coherence tomography. Ophthalmology. 2009;116(12):2305-14.
- Na J, Lee K, Lee J, et al. Detection of macular ganglion cell loss in preperimetric glaucoma patients with localized retinal nerve fiber defects by spectral domain optical coherence tomography. Clin Exp Ophthalmol. 2013;41(9):870-80.
- Ohkubo S, Higashide T, Udagawa S, et al. Focal relationship between structure and function within the central 10 degrees in glaucoma focal relationship between structure and function. IOVS. 2013;55(8):5269-77.
- Naghizadeh F, Garas A, Vargha P, et al. Detection of early glaucomatous progression with different parameters of the RTVue optical coherence tomograph. J Glaucoma. 2014;23(4):195-8.
- Anraku A, Enomoto N, Takeyama A, et al. Baseline thickness of macular ganglion cell complex predicts progression of visual field loss. Graefe's Archive for Clinical and Experimental Ophthalmology. 2014;252(1):109-15.
- Abe R, Gracitelli C, Medeiros F. The use of spectral-domain optical coherence tomography to detect glaucoma progression. The Open Ophthalmology Journal. 2015 May 15;9:78-8.
- American Optometric Association New Technology Report 2014. www.aoa.org/optometrists/tools-and-resources/research-and-information-center/survey-reports/new-technology-and-ehr-survey?sso=y.
- Gordon-Bennett P, Ioannidis A, Papageorgiou K, et al. A survey of investigations used for the management of glaucoma in hospital service in the United Kingdom. Eye. 2013;22(11):1410-8.
- Stein J, Talwar N, LaVerne A., et al. Trends in use of ancillary glaucoma tests for patients with open-angle glaucoma from 2001 to 2009. Ophthalmology. 2012;119(4):748-58.
- Glaucoma Today. 2011. http://glaucomatoday.com/2011/08/fields-of-ohts-the-ocular-hypertension-treatment-study/.
- Langerhorst C, Carenini L, Bakker D, et al. Measurements for description of very early glaucomatous field defects. In: Wall M, Heiji A, editors. eds. Perimetry Update 1996/1997. New York, NY: Kugler Publications; 1997:67–73.
- Hood D, Raza A, de Moraes C, et al. Glaucomatous damage of the macula. Progress in Retinal and Eye Research. 2013 Jan;32:1-21.
- Viswanathan A, Crabb D, McNaught A, et al. Interobserver agreement on visual field progression in glaucoma: a comparison of methods. Br J Ophthalmol. 2013;87(6):726-30.
- Leske M, Heijl A, Hyman L, et al. Predictors of long-term progression in the early manifest glaucoma trial. Ophthalmology. 2007;114(11):1965-72.
- Advanced Glaucoma Intervention Study Investigators. Advanced Glaucoma Intervention Study: 2. Visual field test scoring and reliability. Ophthalmology. 1994;101(8):1445-55.
- Musch D, Lichter P, Guire K, et al. The Collaborative Initial Glaucoma Treatment Study: study design, methods, and baseline characteristics of enrolled patients. Ophthalmology. 1999;106(4):653-62.
- Rao H, Jonnadula G, Addepalli U, et al. Effect of cataract extraction on Visual Field Index in glaucoma. J Glaucoma. 2013;22(2):164-8.
- Horn F, Brenning A, Jünemann A, et al. Glaucoma detection with frequency doubling perimetry and short-wavelength perimetry. J Glaucoma. 2007;16(4):363-71.
- Racette L, Sample P. Short-wavelength automated perimetry. Ophthalmology Clinics of North America. 2003;16(2):227-36.
- Prata T, Lima V, De Moraes C, et al. Short duration transient visual evoked potentials in glaucomatous eyes. J Glaucoma. 2012;21(6):415-20.
- Chen P, Cady R, Mudumbai R, et al. Continued visual field progression in eyes with prior visual field progression in patients with open-angle glaucoma. J Glaucoma. 2010;19(9):598-603.