Understanding Today's State-of-the-art OCT Technology—and Anticipating Tomorrow's
This family of devices has changed the way ODs diagnose and monitor disease. This guide explains when to use which application.
By Lee Vien, OD, and David Yang, OD
Release Date: September 2017
Expiration Date: September 15, 2020
Goal Statement: With optical coherence tomography techniques expanding, optometrists need to know when to apply which modalities to which patients. This article explains how OCT—with an emphasis on enhanced depth imaging, swept source technology and OCT angiography—can be applied clinically to diagnose and monitor macular disease, diabetic retinopathy and glaucoma, among others.
Faculty/Editorial Board: Lee Vien, OD, David Yang, OD
Credit Statement: This course is COPE approved for 2 hours of CE credit. Course ID is 54707-PD. Check with your local state licensing board to see if this counts toward your CE requirement for relicensure.
Disclosure Statements:
Authors: The author has no relationships to disclose.
Editorial staff: Jack Persico, Rebecca Hepp, William Kekevian, Michael Riviello and Michael Iannucci all have no relationships to disclose.
40th Annual Technology ReportFollow the links below to read the other articles from our 40th annual Technology Report: Downsize Your Technology to Enhance Your Practice |
Here, we provide an overview of the many OCT modalities and how you can apply them to the patients walking into your clinic.
Using OCT, Cover to Cover
Anterior segment OCT (AS-OCT) is now available on many instruments. Retinal OCTs can capture and analyze anterior segment scans with a license and software upgrade. Some OCTs require anterior lenses that attach to the instrument to provide wide-view scans to visualize the anterior chamber or angle-to-angle anatomy. AS-OCT can analyze anterior chamber depth, angle measurements and provide pachymetry maps. Its clinical applications range from rigid contact lens fitting to corneal pathologies and complications from corneal surgeries as well as conjunctival lesions. It can also provide an assessment of the tear meniscus in dry eye patients.
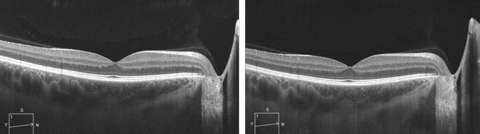 |
| SD-OCT line scan with (at left) and without enhanced depth imaging, which allows for visualization of the choroidal layers and the choroid-scleral interface. Click image to enlarge. |
AS-OCT can be a useful technique for evaluating anterior chamber inflammation in patients with uveitis. This imaging is especially useful in patients with decreased corneal clarity from corneal edema.1
For glaucoma evaluation, AS-OCT can provide valuable images of filtering blebs and tube positioning, as well as the anterior chamber angle, trabecular meshwork and Schlemm’s canal. These images aid ODs in the assessment of structural abnormalities.2-4
Although AS-OCT does not replace gonioscopy in the detection of angle closure, it has increased our understanding of the disease and helped us identify new risk factors so that treatment can be targeted to those patients with higher risk.5,6
Posterior segment OCT provides two main types of macular scans: line scans and macular volume scans. Line scans have adjustable orientation and length and provide a higher definition image of a small area. Macular volume scans, also called cube scans, can provide a three-dimensional image of a larger area, relative to a line scan. Macular volume scans provide macular thickness measurements in the nine standard Early Treatment Diabetic Retinopathy Study macular grid subfields.7 The boundaries of the macular thickness scans are typically the internal limiting membrane (ILM), the inner boundary to the retinal pigment epithelium (RPE) and the outer boundary.8 Variations in the outer boundary, either above or below the RPE, are instrument dependent. Analysis software can help determine whether progression or change has occurred, allowing for the tracking of retinal thickening or thinning over time.
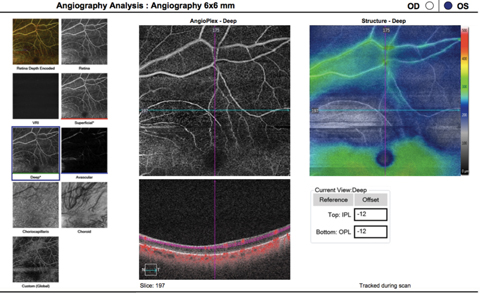 |
| This OCT-A image (6mm by 6mm) shows a patient with a previous branch retinal artery occlusion, as indicated by the well-demarcated area of flow interruption in both superficial and deep vascular capillary plexuses visible on the scan. Click image to enlarge. |
For optic disc scans, OCT captures the circumpapillary retinal nerve fiber layer (cpRNFL) thickness is evaluated. The scan circle diameter can vary with each instrument. The data from the cpRNFL is sampled and thickness values are generated. These can be divided into clock hours, sectors and quadrants that are then compared with a normative database. Optic nerve head (ONH) parameters, such as disc area, rim area, cup-to-disc ratio and cup volume, are also captured and research demonstrates they are sensitive in the detection of glaucomatous change.9,10 Thickness maps based on a thickness scale and deviation maps based on a normative database provide spatial and morphologic information of RNFL damage and can detect RNFL defects.9,10
Macular ganglion cell thickness is now available on SD-OCT instruments. The macular parameters are the ganglion cell complex (GCC)—which includes the ganglion cell layer (GCL), inner plexiform layer (IPL) and RNFL, and ganglion cell-inner plexiform layer (GCIPL)—which includes the GCL and IPL.6
For the diagnosis of early glaucoma, these macular parameters have a high discriminating power and reproducibility comparable to peripapillary retinal nerve fiber layer (pRNFL).11 Macular ganglion cell thickness analysis is also a more reliable diagnostic parameter in the detection of glaucoma for myopic optic disc tilt than ONH parameters.12,13 In advanced stages, research shows GCIPL glaucoma progression analysis (GPA) is more useful than cpRNFL GPA in detecting disease progression.14
OCT can track non-exudative age-related macular degeneration (AMD) progression and identify many features related to the
degenerative process.15-17 These findings include reticular drusen, subretinal drusen deposits, pseudocysts, outer retinal tubulations and drusen-associated acquired vitelliform lesions.15-17
OCT is now routinely used to evaluate diabetic macular edema (DME) and macular edema associated with other conditions, such as retinal vein occlusions. The instrument allows an objective quantification and localization of retinal thickening, providing the ability to track treatment response. Many large clinical trials incorporate OCT measurements into their definitions of macular edema and use those measures as a clinical endpoint.18-22 DME, for instance, was defined by reduced vision and an increase in central subfield thickness on OCT in the RISE and RIDE studies.18 The mean change of central foveal thickness based on OCT was also evaluated as a secondary outcome in the trials.18
New techniques, such as enhanced depth imaging (EDI), SS-OCT and OCT angiography (OCT-A), are providing further insight into ocular structures, such as the choroid, lamina cribrosa and ocular vasculature.
Enhanced Depth Imaging
This recently developed modality allows for improved choroidal evaluation by producing images of structures such as Bruch’s membrane, the choriocapillaris complex, Sattler’s layer, Haller’s layer and the suprachoroidal layer.13 Studies on choroidal thickness with EDI-OCT have identified differences with age, myopia, female gender and increased intraocular pressure (IOP), as well as in certain ocular pathologies such as central serous chorioretinopathy, polypoidal choroidal vasculopathy, vitelliform macular dystrophy and glaucoma.24-28
Researchers have extensively studied choroidal thickness in glaucoma with EDI-OCT.29-33 The pathogenesis of glaucoma has been linked to ischemia that occurs in the prelaminar area of the optic nerve.34 The blood supply to the optic nerve originates from the branches within the peripapillary choroid. OCT research supports an association between glaucoma and impaired choroidal circulation.35 Research using EDI-OCT does not appear to highly correlate choroidal thickness with either open-angle or normal-tension glaucoma, or the severity of glaucomatous damage.31-33
Investigators also studied the lamina cribrosa (LC) and its association with glaucoma.36-38 LC thickness has been associated with severity of glaucoma and found to be thinner in normotensive glaucoma eyes and pseudoexfoliative glaucoma eyes than in primary open-angle glaucoma eyes with the same severity of damage.36-38 In addition, a thinner LC and a larger LC displacement had a significant influence on the rate of progressive RNFL thinning.39
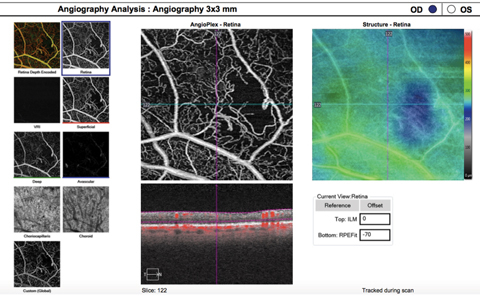 |
| This OCT-A image (3mm by 3mm) of both superficial and deep vascular capillary plexuses shows capillary nonperfusion from severe nonproliferative diabetic retinopathy. An abnormal vascular network is visible adjacent to the area of nonperfusion. Click image to enlarge. |
Swept Source
SS-OCT provides higher image acquisition speed (~100,000 A-scans/seconds), use of a longer wavelength (1050nm to 1060nm), and less variation in sensitivity with depth compared with SD-OCT.40,41 These differences offer advantages over SD-OCT when imaging the vitreous and choroid. In addition, modalities such as en face and OCT-A imaging are improved with SS-OCT as they aid in imaging further into the anterior, as well as deeper into the ocular tissue, than we could with SD-OCT.40,41 Structures in the vitreous that can be visualized with SS-OCT include the posterior precortical vitreous pockets—which play a role in various vitreomacular disorders—Cloquet’s canal, posterior cortical vitreous, posterior hyaloid and vitreous opacities.42,43
The longer wavelength used in SS-OCT provides better penetration of ocular tissues and results in less scattering at the photoreceptor and RPE layers, allowing simultaneous visualization of the choroid, sclera and vitreous.42,44 SS-OCT also offers automated segmentation of choroidal thickness and choroidal thickness maps to help identify abnormalities in the choroid.
Studies comparing EDI-OCT and SS-OCT on penetration depth in choroidal imaging have found both imaging modalities to be comparable in normal eyes.45 However, research shows in conditions such as PCV where the choroid is abnormally thicker, SS-OCT may better detect the choroid-sclera interface.46 SS-OCT also has an advantage over EDI-OCT in imaging the posterior sclera in myopic glaucoma eyes.47 Compared with SD-OCT, SS-OCT has similar intradevice repeatability on the assessment of cpRNFL and macular GC-IPL thickness.48 Imaging of the LC has also been studied with SS-OCT, which can provide a three-dimensional image to better evaluate LC morphology, compared with SD-OCT.49
Although the literature has reported on SS-OCT technology for the last few years, the instruments were mainly prototypes for research. Recently, the FDA approved the first commercially available SS-OCT for assessment of the retina, the Plex Elite 9000 SS-OCT (Carl Zeiss) which has an axial resolution of 5.5µm and a scan speed of 100,000 A-scan points per second. This instrument—as well as the not-yet-FDA-approved Triton SS-OCT (Topcon)—offers widefield scans and OCT-A, but differ in their software and analysis. The Triton’s normative database is not FDA approved in the United States, and the current Plex Elite 9000 does not have a reported normative database.
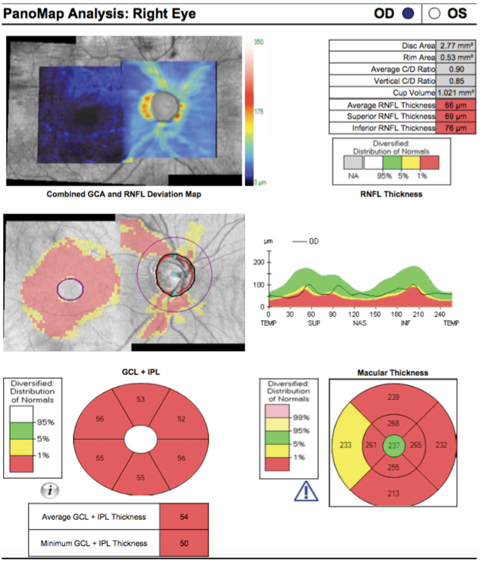 |
| This SD-OCT PanoMap shows a glaucoma patient with thinning of the retinal nerve fiber layer as well as ganglion cell analysis. Click image to enlarge. |
OCT Angiography
This technique employs sequential high-speed OCT scans taken at the exact same location to detect motion. Movement is determined when the camera detects a difference in signal intensity between the two scans. Assuming steady patient fixation, the successive OCT scans should be identical, except for moving elements such as erythrocytes. The movement of red blood cells can be seen due to variation from one image to another, thus allowing for examination of blood flow in the retinal vasculature at various depths. This makes OCT-A a beneficial adjunctive test to fluorescein angiography (FA) and indocyanine green angiography (ICG).
OCT-A can delineate the foveal avascular zone and areas of capillary dropout better than FA and ICG.50-54 However, there are limitations to OCT-A, such as a small field of view, making it a poor technique for imaging the peripheral retina. Additionally, it is not able to show leakage, staining or pooling, which FA and ICG can.50-52,55 Moreover, current OCT-A instruments are prone to artifacts from eye movement, eyelid blinks, signal attenuation, shadows and segmentation errors. These movements can result in vessel doubling, stretch artifacts, displacement artifacts, checkerboard defects, gap defects and false-positive flow defects. Blockage and attenuation of the OCT-A signal can occur due to blinking and ocular media opacities such as cataracts, vitreal floaters and corneal scars. If the signal is sufficiently blocked, it can result in vascular areas misidentified as vasculature loss or areas of no flow. Other artifacts can result from errors in the segmentation of the various retinal layers. If layers are misidentified, data can be combined from multiple layers, resulting in inappropriate mapping.51,53,56,57
Vascular layers deep to the RPE can be imaged better with swept-source technology vs. SD-OCT, owing to the deeper penetration of tissue with its longer wavelength. In a study comparing the two techniques for imaging the choriocapillaris beneath drusen, SS-OCT-A was found to be less prone to false-positive low flow areas.58
OCT-A is currently being used to study various retinal and choroidal pathologies, as well as ONH disorders.50-53 Increasingly, the evidence in the literature describes its use in AMD, diabetic retinopathy and vascular occlusive disease, as well as other retinal conditions.50-53 In some cases, it is even detecting pathology that was not seen on FA.59,60 Doctors can use OCT-A’s ability to detect movement to identify nonexudative type 1 neovascular (NV) lesions, even in asymptomatic patients with intermediate AMD.59,60 These lesions were not appreciated on FA and there was no fluid seen on structural OCT imaging, although these areas of neovascularization were associated with plaques seen on ICG.59,60 A recent study showed the combination of OCT-A and structural OCT can detect type 1 NV lesions in 85.7% of eyes, which was superior to structural OCT or FA alone (66.7%).61
In patients with diabetic retinopathy, OCT-A can better delineate the foveal avascular zone and areas of capillary dropout compared with FA, while also providing a higher percentage of gradable images.54
OCT-A is also being used to examine various optic neuropathies, including glaucoma, papilledema, anterior ischemic optic neuropathy and other acute and chronic optic nerve disorders.62-64 Studies show OCT-A can provide noninvasive imaging of the microvasculature of the ONH and adjacent peripapillary tissue.62-64 Research demonstrates decreased peripapillary perfusion—as imaged by OCT-A—has excellent correlation with areas of RNFL atrophy—as measured by structural OCT—in glaucoma patients.63
Additionally, other studies have revealed a decrease in vessel density of the peripapillary capillary network in eyes with various optic neuropathies. This supports the relationship of decreased retinal vasculature associated with glaucomatous and nonglaucomatous RNFL atrophy.62-64
 |
| This OCT-A (6mm by 6mm) image shows the same patient as the image on page 73. Here, you can see a decrease in peripapillary capillary perfusion corresponding to the areas of RNFL loss. Click image to enlarge. |
Limitations of Today’s OCT
Artifacts can be a source of error when obtaining OCT images, and they may affect the measurement of retinal thickness. These artifacts include motion artifacts and media opacities that can block the signal. Some pathologies can also contribute directly to segmentation errors, such as epiretinal membranes, vitreopapillary traction or vitreomacular traction. Interpretation of the OCT color-coding can be falsely positive or negative given the limited normative database for each instrument. These databases have a narrow age range, refractive error range and limited ethnic groups.65,66 Patients with displaced RNFL bundles, such as high myopia and tilted discs, are examples of patients who may not fit the normative database. For these patients that fall outside the normative database, longitudinal evaluation of the cpRNFL is important to detect disease progression.
Advancements
Recent innovations in OCT imaging have improved the diagnostic ability of the instrument, especially in the detection of glaucomatous damage. These new OCT parameters include Bruch’s membrane opening-minimum rim width (BMO-MRW) and BMO-minimum rim area (MRA). BMO-MRW quantifies the rim from its true anatomic outer border and accounts for variable orientation. Its width has a higher diagnostic accuracy for glaucoma and a stronger correlation with visual field compared with conventional rim parameters including cpRNFL, according to researchers.67,68 The new parameter is also more specific than GCIPL in tilted disc with moderate myopia.69 BMO-MRA is not influenced by disc size, unlike BMO-MRW, and offers superior diagnostic power to detect glaucoma compared with other parameters in a full range of very large to small disc sizes.70 Additional studies using these new parameters are still needed to establish a normative database. However, current research shows a greater specificity of these new parameters when considering the highly variable anatomy of the ONH both within and between individuals.67-70
The advent of OCT technology has improved optometrists’ ability to detect, understand, monitor and track progression of various ocular pathologies, as well as response to treatment modalities. Advances in imaging techniques with EDI-OCT and SS-OCT have provided the ability to visualize the choroid and gain new insights on the role of the choroid in chorioretinal conditions. SS-OCT technology has also improved imaging of the vitreous and enhanced techniques such as en face and OCT-A. With the introduction of OCT-A, we now have the ability to visualize abnormal blood flow in the choroid and retina.
New software and hardware upgrades have improved the repeatability, reliability and diagnostic capability of OCT scans. Recently introduced ONH parameters, such as BMO-MRW and BMO-MRA, have shown potential on its specificity, especially in glaucoma detection. OCT has many applications in clinic today, but future studies will determine the full extent to which these new technologies can improve patient care.
Dr. Vien practices at the Veterans Affairs Palo Alto Healthcare System and is an assistant clinical professor at University of California Berkeley School of Optometry and Southern California College of Optometry at Marshall B. Ketchum University.
Dr. Yang practices at the Veterans Affairs Palo Alto Healthcare System and is a clinical professor at the University of California Berkeley School of Optometry.
| 1. Igbre A, Rico M, Garg S. High-speed optical coherence tomography as a reliable adjuvant tool to grade ocular anterior chamber inflammation. Retina. 2014;34(3):504–8. 2. Wang D, Shan L. New developments in anterior segment optical coherence tomography for glaucoma. Curr Opin Ophthalmol. 2016;27(2):111-7. 3. Han S, Liu Y, Noriega K, Mehta J. Applications of anterior segment optical coherence tomography in cornea and ocular surface disease. J Ophthalmol. 2016;2016:4971572. 4. Narayanaswamy A, Sakata L, He M, et al. Diagnostic performance of anterior chamber angle measurements for detecting eyes with narrow angles: an anterior segment OCT study. Arch Ophthalmol. 2010;128(10):1321-7. 5. Radhkrshnan S, Yarovoy D. Development in anterior segment imaging for glaucoma. Curr Opin Ophthalmol. 2014;25(2):98-103. 6. Nongpiur M, Ku J, Aung T. Angle closure glaucoma: a mechanistic review. Curr Opin Ophthalmol. 2011;22(2):96–101. 7. Early Treatment Diabetic Retinopathy Study Research Group. Photocoagulation for diabetic macular edema: Early Treatment Diabetic Retinopathy Study report number 1. Arch Ophthalmol. 1985 Dec;103(12):1796-806. 8. Ho J, Sull A, Voung L, et al. Assessment of artifacts and reproducibility in pathological eyes across the spectral and time domain optical coherence tomography devices. Ophthalmology. 2009 Oct;116(10):1960-70. 9. Hwang YH, Kim YY, Kim HK, Sohn YH. Ability of Cirrus high-definition spectral-domain optical coherence tomography clock-hour, deviation, and thickness maps in detecting photographic retinal nerve fiber layer abnormalities. Ophthalmology. 2013;120(7):1380-7. 10. Leung CK, Lam S, Weinreb RN, et al. Retinal nerve fiber layer imaging with spectral-domain optical coherence tomography: analysis of the retinal nerve fiber layer map for glaucoma detection. Ophthalmology. 2010;117(9):1684-91. 11. Nakatani Y, Higashide T, Ohkubo S, et al. Evaluation of macular thickness and peripapilllary retinal nerve fiber thickness for detection of early glaucoma using spectral domain optical coherence tomography. J Glaucoma. 2011;20(4):252-9. 12. Shin H, Park HL, Park CK. The effect of myopic optic disc tilt on measurement of spectral-domain optical coherence tomography parameters. Br J Ophthalmol 2015;99(1):69-74. 13. Shoji T, Nagaoka Y, Sato H, et al. Impact of high myopia on the performance of SD-OCT parameters to detect glaucoma. Graeges Arch Clin Ecp Ophthalmol. 2012;250(12):1843-9. 14. Shin J, Sung K, Lee G, et al. Ganglion cell-inner plexiform layer change detected by optical coherence tomography indicates progression in advanced glaucoma. Ophthalmology. 2017;17:30579-1. 15. Hogg R, Silva R, Staurenghi G, et al. Clinical characteristics of reticular pseudodrusen in the fellow eye of patients with unilateral neovascular age-related macular degeneration. Ophthalmology. 2014;121(9):1748-55. 16. Hariri A, Nittala M, Sadd SR. Outer retinal tubulation as a predictor of the enlargement amount of geographic atrophy in age-related macular degeneration. Ophthalmology. 2015;122(2):407-13. 17. Lima L, Laud K, Freund K, et al. Acquired vitelliform lesion associated with large drusen. Retina. 2012;32(4):647-51. 18. Nguyen QD, Brown D, Marcus D, et al. Ranibizumab for diabetic macular edema: results from 2 phase II randomized trials: RISE and RIDE. Ophthalmology. 2012;119(4):789-801. 19. Elman M, Qin H, Aiello L, et al. Diabetic Retinopathy Clinical Research Network. Intravitreal ranibizumab for diabetic macular edema with prompt versus deferred laser treatment: three-year randomized trial results. Ophthalmology. 2012;119(11):2312-8. 20. Do DV, Nguyen QD, Khwaja AA, et al. READ-2 Study Group. Ranibizumab for edema of the macula in diabetes study: 3-year outcomes and the need for prolonged frequent treatment. JAMA Ophthalmol. 2013;131(2):139-45. 21. Campochiaro P, Heier J, Gray S, et al. Ranibizumab for macular edema following branch vein occlusion: six-month primary end point results of a phase III study. Ophthalmology. 2010;117(6):1102-12. 22. Brown D, Campochiaro P, Singh R, et al. Ranibizumab for macular edema following central vein occlusion: six-month primary end point results of a phase III study. Ophthalmology. 2010;117(6):1124-33. 23. Huynh E, Chandraskera E, Buikowska D, et al. Past, present, and future concepts of the choroidal scleral interface morphology on optical coherence tomography. J Ophthalmol. 2017;6(1):94–103. 24. Chen G, Tzekov R, Li W, et al. Subfoveal choroidal thickness in central serous chorioretinopathy: A meta-analysis. PLoS One. 2017; 12:e0169152. 25. Kim Y, Kang S, Bai K. Choroidal thickness in both eyes of patients with unilaterally active central serous chorioretinopathy. Eye. 2011;25(12):1635-4. 26. Maruko I, Lida T, Sugano Y, et al. Subfoveal choroidal thickness in fellow eyes of patients with central serous chorioretinopathy. Retina. 2011;31(8):1603-8. 27. Lee W, Baek J, Dansingani K, et al. Choroidal morphology in eyes with polypoidal choroidal vasculopathy and normal or subnormal subfoveal choroidal thickness. Retina. 2016;36:S73-82. 28. Yang L, Jonas J, Wei W. Optical coherence tomographic enhanced depth imaging of polypoidal choroidal vasculopathy. Retina. 2013;33(8);1584-9. 29. Abega˜o Pinto L, Willekens K, Van Keer K, et al. Ocular blood flow in glaucoma—the Leuven Eye Study. Acta Ophthalmol. 2016;94(6):592–8. 30. Maul E, Friedman D, Chang D, et al. Choroidal thickness measured by spectral domain optical coherence tomography: factors affecting thickness in glaucoma patients. Ophthalmology. 2011;118(8):1571–9. 31. Mwanza J, Hochberg J, Banitt M, et al. Lack of association between glaucoma and macular choroidal thickness measured with enhanced depth-imaging optical coherence tomography. Invest Ophthalmol Vis Sci. 2011;52(5):3430–5. 32. Rhew J, Kim Y, Choi K. Measurement of subfoveal choroidal thickness in normal-tension glaucoma in Korean patients. J Glaucoma. 2012. [Epub ahead of print] 33. Park HY, Lee NY, Shin HY, Park CK. Analysis of macular and peripapillary choroidal thickness in glaucoma patients by enhanced depth imaging optical coherence tomography. J Glaucoma. 2014;23(4):225-31. 34. Hayreh S. Blood supply of the optic nerve head and its role in optic atrophy, glaucoma, and oedema of the optic disc. Br J Ophthalmol. 1969;53(11):721–48. 35. Grunwald JE, Piltz J, Hariprasad SM, DuPont J. Optic nerve and choroidal circulation in glaucoma. Invest Ophthalmol Vis Sci. 1998;39(12):2329–36. 36. Downs J, Girkin C. Lamina cribrosa in glaucoma. Curr Opin Ophthalmol. 2017;28(2):113 –9. 37. Kim Y, Park K. Lamina cribrosa defects in eyes with glaucomatous disc haemorrhage. Acta Ophthalmol. 2016;94(6);468-73. 38. You JY, Park SC, Su D, et al. Focal lamina cribrosa defects associated with glaucomatous rim thinning and acquired pits. JAMA Ophthalmol. 2013;131(3):314-20. 39. Lee E, Kim T, Kim M, Kim H. Influence of lamina cribrosa thickness and depth on the rate of progressive retinal nerve fiber thinning. Ophthalmology. 2015;122(4):721-9. 40. Hirata M, Tsujikawa A, Matsumoto A, et al. Macularchoroidal thickness and volume in normal subjects measured by swept-source optical coherence tomography. Invest Ophthalmol Vis Sci. 2011;52(8):4971-8. 41. Adhi M, Liu JJ, Qavi AH, et al. Choroidal analysis in healthy eyes using swept-source optical coherence tomography compared to spectral domain optical coherence tomography. Am J Ophthalmol. 2014;157(6);1272-81. 42. Lavinsky F, Lavinsky D. Novel perspectives on swept-source optical coherence tomography. Int J Retina Vitreous. 2016;2:25. 43. Kishi S, Hagimura N, Shimizu K. The role of the premacular liquefied pocket and premacular vitreous cortex in idiopathic macular hole development. Am J Ophthalmol. 1996;122(5):622–8. 44. Chen Y, Burnes DL, De Bruin M, et al. Three-dimensional pointwise comparison of human retinal optical property at 845 and 1060 nm using optical frequency domain imaging. J Biomed Opt. 2009;14:024016. 45. Waldstein SM, Faatz H, Szimacsek M, et al. Comparison of penetration depth in choroidal imaging using swept source vs spectral domain optical coherence tomography. Eye. 2015;29(3):409-15. 46. Ting DS, Cheung GC, Lim LS, et al. Comparison of swept source optical coherence tomography and spectral domain optical coherence tomography in polypoidal choroidal vasculopathy. Clinical and Experimental Ophthalmology. 2015;43(9):815-9. 47. Park HY, Shin HY, Park CK. Imaging the posterior segment of the eye using swept-source optical coherence tomography in myopic glaucoma eyes: comparison with enhanced-depth imaging. Am J Ophthalmol. 2014;157(3):550-7. 48. Lee SY, Bae HW, Kwon HJ, et al. Repeatability and agreement of swept source and spectral domain optical coherence tomography evaluations of thickness sectors in normal eyes. J Glaucoma 2017;26(2):46-53. 49. Nuyen B, Mansouri K, Weinreb RN. Imaging of the lamina cribrosa using swept-source optical coherence tomography. J Current Glau Prac. 2012;6(3): 113-119. 50. de Carlo TE, Romano A, Waheed NK, Duker JS. A review of optical coherence tomography angiography (OCT-A). Int J Retina Vitreous. 2015 Apr 15;1:5. eCollection 2015. 51. Lee J, Rosen R. Optical coherence tomography angiography in diabetes. Curr Diab Rep. 2016;16(12):123. 52. de Barros Garcia JMB, Isaac DLC, Avila M. Diabetic retinopathy and optical coherence tomography angiography: clinical findings and future perspectives. ). Int J Retina Vitreous. 2017 Mar 13;3:14. eCollection 2017. 53. Chalam KV, Sambhav K. Optical coherence tomography angiography in retinal diseases. J Ophthalmic Vis Res. 2016;11(1):84-92. 54. Soares M, Neves C, Marques IP, et al. Comparison of diabetic retinopathy classification using fluorescein angiography and optical coherence tomography angiography. Br J Ophthalmol. 2017;101(1):62-68. 55. Yu S, Lu J, Cao D, et al. The role of optical coherence tomography angiography in fundus vascular abnormalities. BMC Ophthalmology. 2016:16:107. 56. Spaide RF, Fujimoto JG, Waheed NK. Image artifacts in optical coherence angiography. Retina. 2015;35(11):2163-80. 57. de Oliveira PR, Berger AR, Chow DR. Optical coherence tomography angiography in chorioretinal disorders. Can J Ophthalmol. 2017;52(1):125-36. 58. Lane M, Moult EM, Novais EA, et al. visualizing the choriocapillaris under drusen: comparing 1050-nm swept-source versus 840-nm spectral-domain optical coherence tomography angiography. Invest Ophthalmol Vis Sci 2016;57(10):585-90. 59. Palejwala N, Jia Y, Gao S, et al. Detection of non-exudative choroidal neovascularization in age-related macular degeneration with optical coherence tomography angiography. Retina. 2015;35(11):2204-11. 60. Roisman L, Zhang Q, Wang RK, et al. Optical coherence tomography angiography of asymptomatic neovascularization in intermediate age-elate macular degeneration. Ophthalmology. 2016;123(6):1309-19. 61. Inoue M, Jung J, Balaratnasingam C, et al. A comparison between optical coherence tomography angiography and fluorescein angiography for the imaging of type 1 neovascularization. Invest Ophthalmol Vis Sci. 2016;57:314-23. 62. Lee EJ, Lee KM, Lee SH, Kim TW. OCT angiography of the peripapillary retina in primary open-angle glaucoma. Invest Ophthalmol Vis Sci. 2016;57:6265-70. 63. Falavarjani KG, Tian JJ, Akil H, et al. Swept-source optical coherence tomography angiography of the optic disk in optic neuropathy. Retina. 2016;36:S168-S177. 64. Chen J, AbouChehade J, Iezzi R, et al. Optical coherence angiographic demonstration of retinal changes from chronic optic neuropathies. Neuroophthalmology. 2017;41:76-83. 65. Kim N, Lim H, Kim J, et al. Factors associated with false positives in retinal nerve fiber layer color codes from spectral-domain optical coherence tomography. Ophthalmology. 2011;118:1174-81. 66. Sayed M, Margolis M, Lee R. Green disease in optical coherence tomography diagnosis of glaucoma. Curr Opin Ophthalmol. 2017;28:139-153. 67. Chauhan B, Danthurebandara V, Sharpe G, et al. Bruch’s membrane opening minimum rim width and retinal nerve fiber layer thickness in a normal white population: a multicenter study. Ophthalmology. 2015;122:1786–94. 68. Chauhan B, O’Leary N, Almobarak F, et al. Enhanced detection of open-angle glaucoma with an anatomically accurate optical coherence tomography-derived neuroretinal rim parameter. Ophthalmology. 2013;120:535–43. 69. Rebolleda G, Casado A, Oblanca N et al. The new Bruch’s membrane opening – minimum rim width classification improves optical coherence tomography specificity in tilted discs. Clin Ophthalmol. 2016;10:2417-25. 70. Enders P, Adler W, Schaub F, et al. Novel Bruch’ membrane opening minimum rim area equalizes disc size dependency and offers high diagnostic power for glaucoma. Invest Ophthalmol Vis Sci. 2016;57:6596-603. |